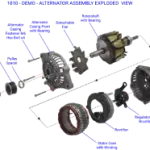
Alternator Generator detailed teardown & feature mapping
BLDC Hub Motor Teardown & Should Costing
BiW Benchmarking – Loadpath, RM, Sections, Cost, Philosophy
Current methods of benchmarking BiW for Passenger cars for understanding its design philosophy, the load path, raw material usage, section details (Modulus, Thickness & Material Grade) & Manufacturing Cost incurs huge cost of activity and more time. Considering the reduction in launch to launch cycle time, the data required from benchmarking has to be in the right quantity and of right quality in the least possible time, else the cost invested in the benchmarking activity is futile.
*All data/graphs/trends/images presented on this page are dummy/heavily masked/edited to remove specific details. They are intended only to showcase sample outcomes of such activities.
On this page, we will discuss the alternative approach to study BiW for Passenger cars comprehensively yet quickly to support OEM’s with readily accessible data for benchmark to take decisions for new product development or cost savings in the existing vehicles. We will be discussing the approach & results while referring to a few examples from our past internal projects.
Why do we benchmark BiW ?
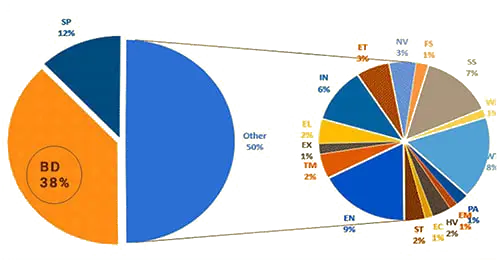
- The BiW & 6 closures frame contributes for 30%-40% of the total vehicle, due to which the cost, complexity & weight impact is high on the vehicle. The above Figure shows the general distribution of sub-systems in a vehicle.
- Technical understanding of BiW:
- Weight contribution of key systems and identification of potential for weight savings
- Energy Management Strategy in the event of Offset & Lateral Crash Scenarios
- Vehicle Integration & packaging of components for simplified solutions
- Material usage strategy, Advanced HSS, HSS, Tailored WB, Forming Steel with yield strength ranging between 160-200-280-320-1200 MPa
- Construction, complexity, ease of assembly & no. of modules/zones
- Joineries (Spot Weld, Arc Weld, Sealants, Adhesive, Projection Welding, Hemming, Fusion Welding etc.)
- Corrosion Resistance Treatments (coatings layers & thickness)
- Commercial Understanding:
- Cost comparison & identifying delta
- Understanding zone/module wise cost distribution (Aesthetics/Strength/Mountings)
- Key cost driver identification
Past Experience of Activities on BiW
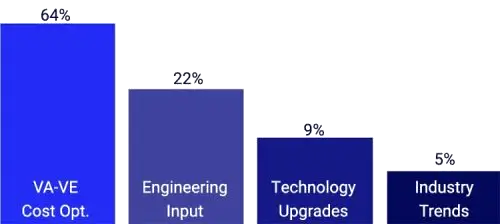
We have conducted more than 10 studies on BiW of Hatchback, Sedan, CSUV & SUV and found that 64% of the customers are benchmarking the competition for cost reduction by adopting our 9-stage cost reduction strategy which results in 6%-8% of cost savings approximately. 22% of the clients came to us for Engineering Input where key requirement was to providing inputs for new product development. These inputs include Assembly hierarchy wise Bill of Material, CAD data, Load Path Diagrams for energy management study, 2D sections at 1:1 scale, Raw Material Usage Distribution & properties & Coating Thickness. Another set of 9% clients just wanted to understand the technology upgrades in terms of advanced material usage & new manufacturing processes. No one actually requested for industry trends but 5% of the clients who also asked for VA-VE or Engineering Inputs asked for Understanding Trends, Identifying the pattern & Report the same along with other deliverables.
What all can be studied from BiW of a competitor?
Before we jump on to the details of the alternate approach to benchmark BiW in least time at least cost, shown below is the list of individual studies that can be conducted on Body In White to extract information that can be used as engineering intelligence to answer key questions.
1. Energy management study
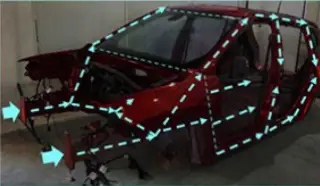
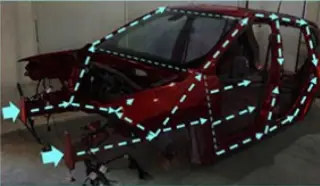
In order to study the load path for different load case scenarios (Frontal, Offset, Side Impact), energy flow diagram on the BiW is created to identify the critical sections which are the key contributors for meeting crash norms. In the end of this activity, multiple flow diagrams for different load cases with critical sections (>120 areas) are identified for further detailed study.
2. Critical sections preparation
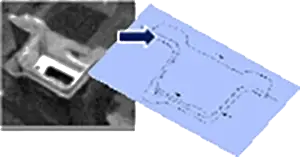
Based on sections identified, 1:1 CAD files of the sections are prepared after physically cutting them from the BiW assembly. This data mapping exercise is required to reinforce the energy management study with additional key information such as profile shape, panel thickness, coating layer details & section modulus. On overlapping the flow diagram of the competition vehicle with the 2D sections in place the deviations and gaps can provide insights on the competitor philosophy of either transfer of energy or absorbing it at that zone.
3. Raw Material Analysis
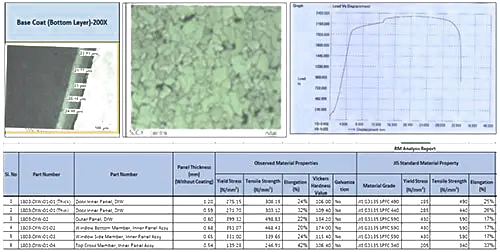
Raw material distribution along with physical properties (Tensile Strength, Vickers hardness, % elongation and ultimate strength), chemical properties & thickness film analysis to understand the various layer of coating (paint, ED & Galvanisation). Based on the test lab results the data is triangulated with the standard material library to assess the exact grade of materials, in case of grades that are not matching with the existing grades are assigned specific special grade and material cards are generated. This data helps in understanding the strength of the regions/modules within the BiW, overall engineering philosophy & material library to benchmark.
4. Assembly sequence & process mapping
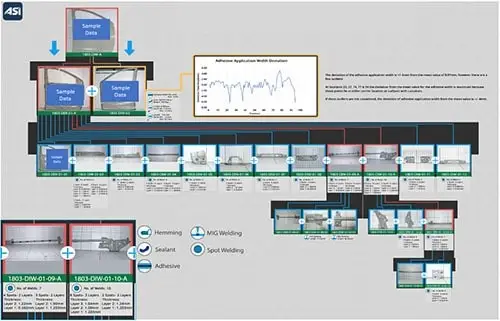
5. Sealant & Adhesive details
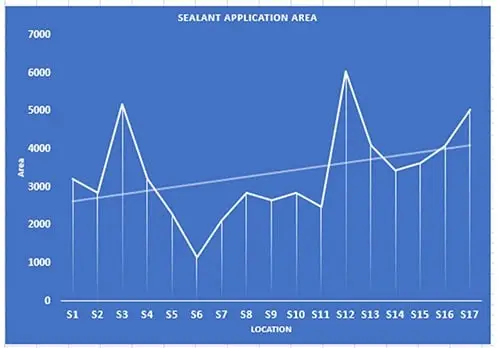
Considering the huge cost of sealants & adhesives, it is critical to study the application areas, quantity & type of adhesive or sealant used in BiW. It is also important that we study the reasons behind usage of sealants & adhesives in order to understand the thought process of the OEM.
6. Welding information
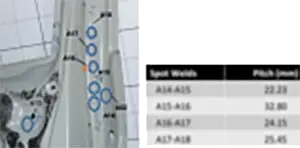
Strength of Body In White depends on how the panels are held together, in general a BiW has approximately 3000 spot welds that holds 3 ply,2 ply or 4 ply panels with nugget diameter of 6-8 mm with pitch between 20-150 mm. The general information is good to know the facts but specific spot weld location, dia, ply thickness, & pitch is very critical from the strength perspective. The behaviour of BiW undergoing torsion, bending or Frontal crash will entirely change if you change the position or size of the welds. To deliver this information, shell scan of the body in white is done and at all spot weld locations spheres are created in 3D cad and shared with the client.
7. Bill of material
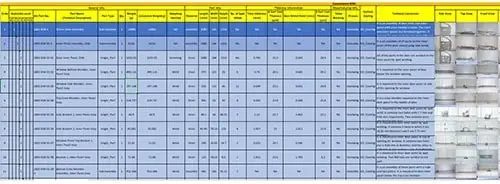
The bill of material contains >35 parameters mapped per part with hierarchy mapped as it is on the Body In White. These parameters mapped here help in understanding the weight distribution, quantity, purpose, coating types & thickness, part’s box size & joinery types etc… Basically, all parameters that either impact cost or the function of the part is mapped and later utilized for VA-VE activity, directional costing & engineering inputs.
8. Thickness Map
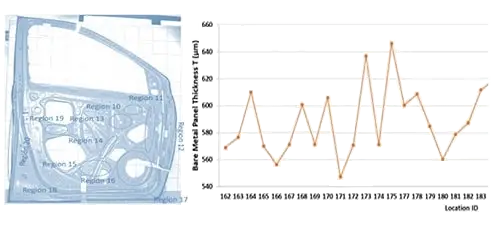
In order to understand the thinning percentage, thickness is mapped for all the parts that are formed during stamping process. Thinning reduces the strength of the local region; hence it is critically planned while simulating the formability of steels. Parts should thin in the non-safety or non-strength critical areas only.
9. Full Reverse Engineering
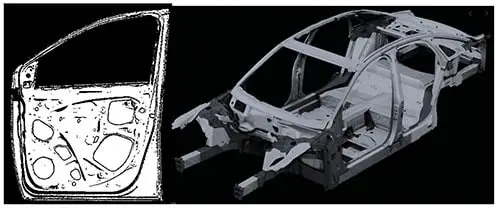
The competitor BiW & all 6 door closures are scanned and re-surface modelling is done for all A, B & C class surfaces. The entire CAD with all parts assembled and weld information mapped is created in 3D modelling software with BOM. This data is along with RM properties is used to simulate the model for crash and other load cases and benchmark results for better design of Body In White.
10. Mounting Philosophy
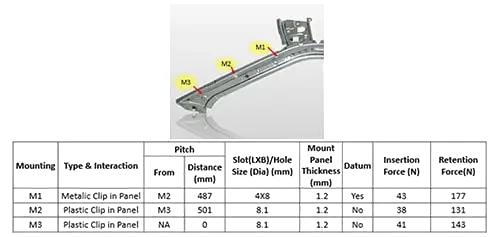
Around 20% of the parts in BiW are there to integrate other system parts on to the frame. The mounting philosophy report is generated for all the parts that are mounted on the BiW with fastener types, spacing, datum identification & packaging efficiency information. This information is used for VA-VE exercise reasoning or feasibility of the proposal generated while doing the idea generation workshop.
11. Directional Costing
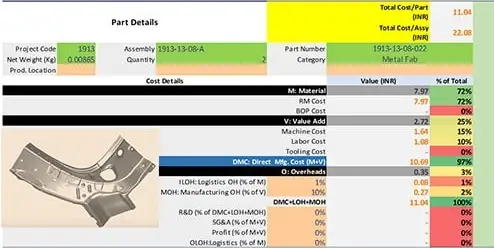
Without having cost estimates, it is difficult to quantify the worth of a VA-VE activity. With our xcPEP tool we are able to estimate cost of all the components with certain assumptions on the process, location, labour rates & tooling investment side. This assumptions sheet is configurable and flexible enough to update the calculations with a few clicks on the software.
12. Data Analytics
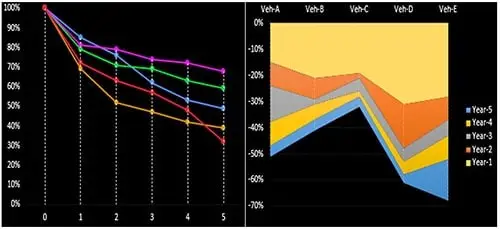
Once all the data is mapped, analysis is the next step. Based on the list of parameters that are mapped, analysis can be customised to answer questions specific to either cost saving, weight saving, parts standardisation, commonisation & others. Our xcPEP tool supports here in writing analysis algorithms quickly and executing them on the data mapped for the activity.
What is an effective benchmarking method?
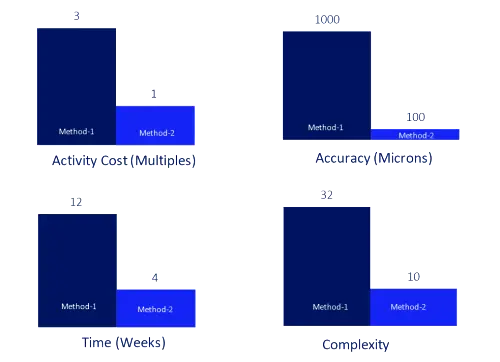
Method-1: Teardown, Full BiW Reverse Engg. & CAE Simulation
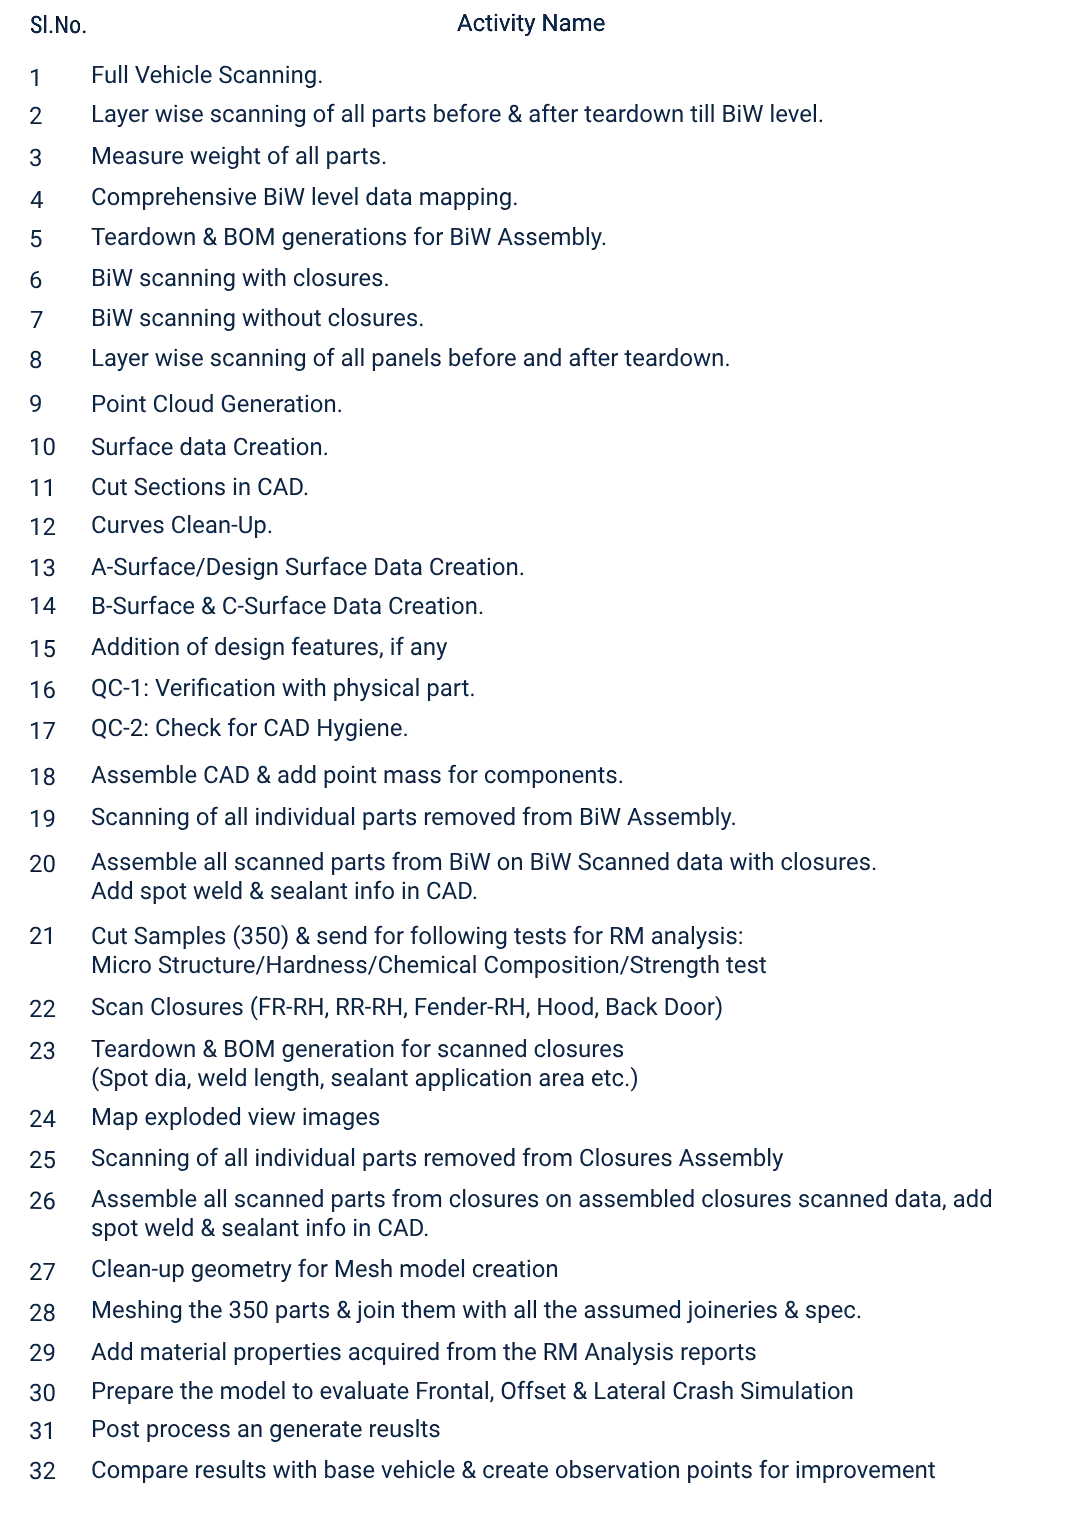
In this method full vehicle is scanned initially followed by layer wise teardown and scanning of BiW & parts. Later all the scanned data is converted to CAE ready 3D CAD. Here, Teardown is conducted & detailed BOM is also generated with multiple parameters. Later the CAD files are provided to the client for CAE & analysis. The image shown below are the steps followed to complete the activity.
Method-2: Load path mapping with 2D Sections
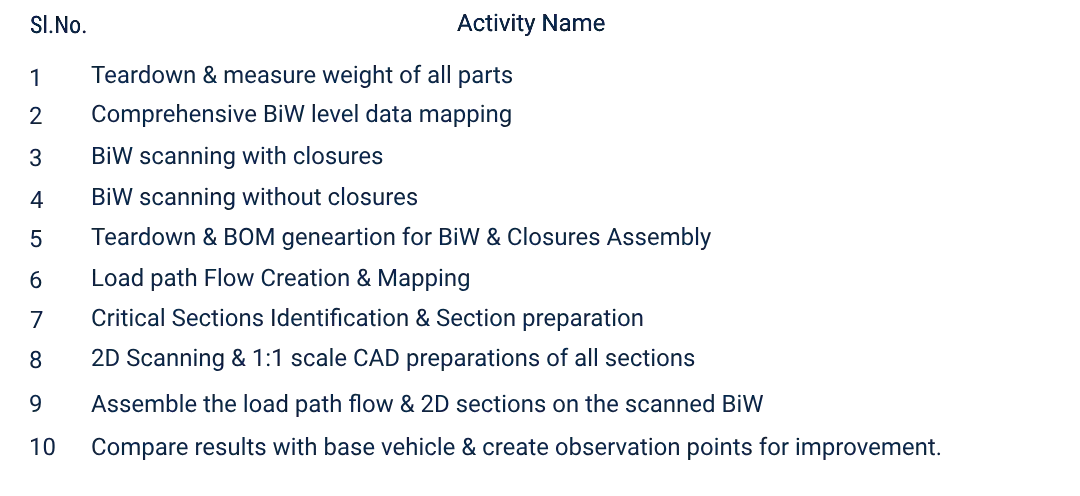
In this method, the BiW is analyzed and during brainstorming sessions with OEM’s CAE engineers, multiple load case scenarios are created and load path diagrams are analyzed. Once, the load path flow is created, the critical junctions and sections are identified to benchmark in detail. The identified sections are later physically cut and reverse engineered as 3D 1:1 scale diagram. Material properties analyzed parallelly and the 3 information streams (load paths, sections & RM results) are merged to benchmark with the base BiW for which the insights are being generated. The comparison will help in understanding the areas where a gap exists & help in answering the questions of what, where, and why for BiWs. The following image shows the no of steps with details that are followed to complete this activity.
Which method is better?
