Refrigerator Should Cost Analysis & Teardown Teardown & Cost Analysis
Teardown and should cost analysis analysis of a Haier Direct Cool 190 Ltr (2-Star) single-door refrigerator. ~500 parts analyzed with estimated should-cost of ?10,222.20 per unit.
This study presents a teardown and refrigerator should cost analysis analysis of a Haier Direct Cool 190 Ltr (2-Star) single-door model, carried out by ASI Engineering with xcPEP to evaluate its design, materials, and manufacturing economics.
Refrigerators are among the most widely produced and cost-sensitive appliances, making cost transparency essential for manufacturers and procurement teams worldwide. Total estimated should-cost: ?10,222.20 per unit at 40,000 units/year.
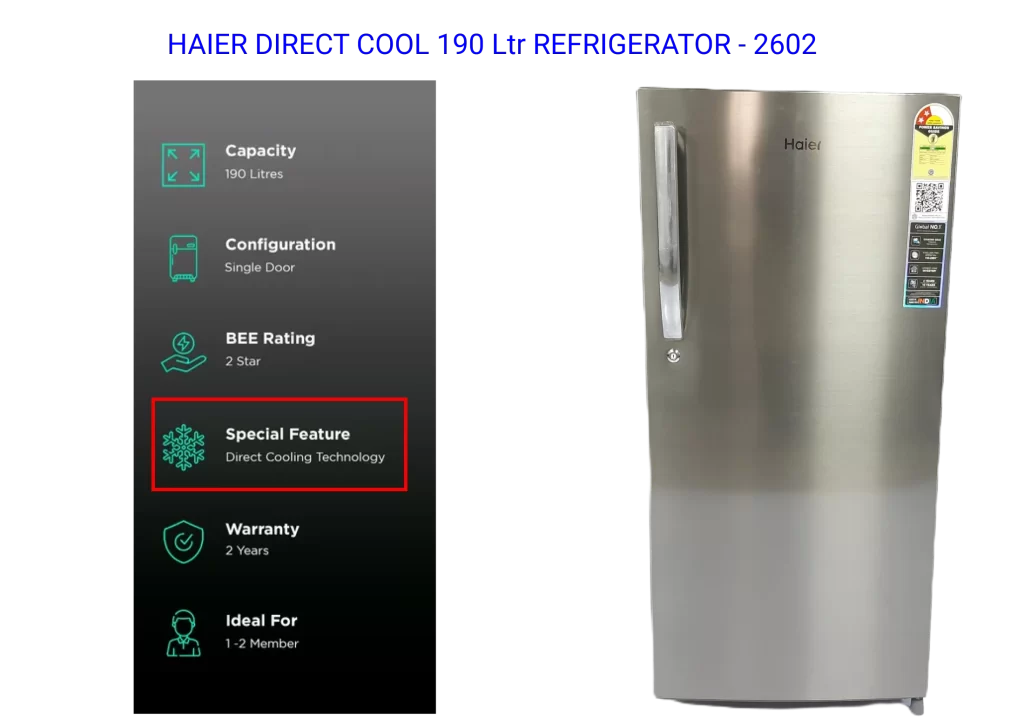
Direct Cool Technology, EKZ60K fixed-speed reciprocating compressor (220---240V, 50Hz), R600a refrigerant, 190L total capacity, 14L freezer with Diamond Edge Technology, toughened glass shelves, manual defrost with drain water collector.
Assembly-wise weight distribution, part count distribution by manufacturing category, weight distribution by manufacturing category, bought-out parts analysis, detailed should cost analysis with raw material/process/overhead breakdown.
01Features & Specifications
Introduction
Refrigerators are among the most widely produced and cost-sensitive appliances, making cost transparency essential for manufacturers and procurement teams worldwide. This study presents a teardown and refrigerator should cost analysis analysis of a Haier Direct Cool 190 Ltr (2-Star) single-door model, carried out by ASI Engineering with xcPEP to evaluate its design, materials, and manufacturing economics.
Direct Cool Technology
The refrigerator uses Direct Cool technology for its cooling operation. It relies on natural convection, meaning there is no fan to circulate air. This results in lower energy consumption and minimal noise during operation. The defrosting process is manual and can be activated using a push-button, requiring periodic user intervention to remove frost buildup.
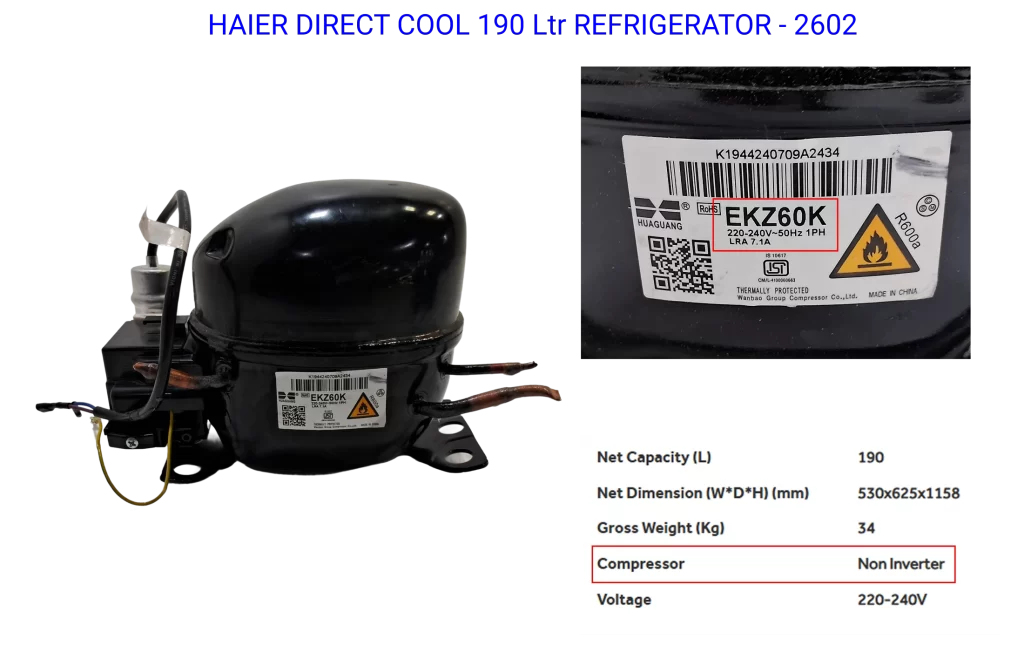
Compressor Specifications
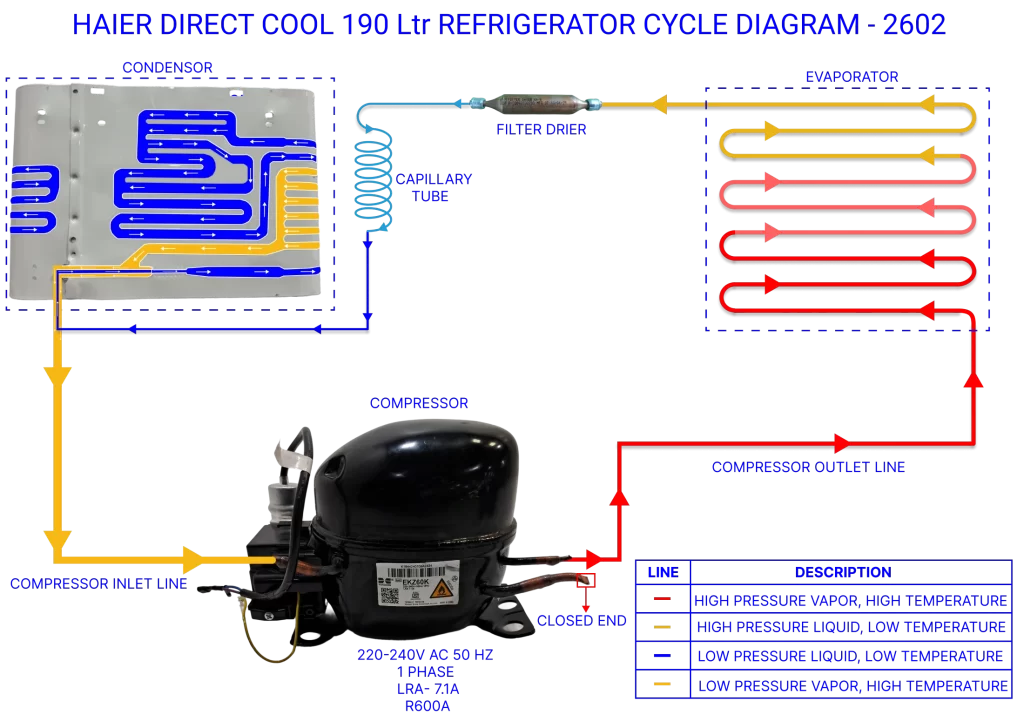
The EKZ60K is a fixed-speed reciprocating compressor operating on a 220---240V, 50 Hz single-phase supply. It uses R600a (Isobutane) refrigerant and has a Locked Rotor Amps (LRA) rating of 7.1A. Its approximate cooling capacity is 600---700 BTU/h, ideal for small direct cool refrigerators.
Capacity & Internal Layout
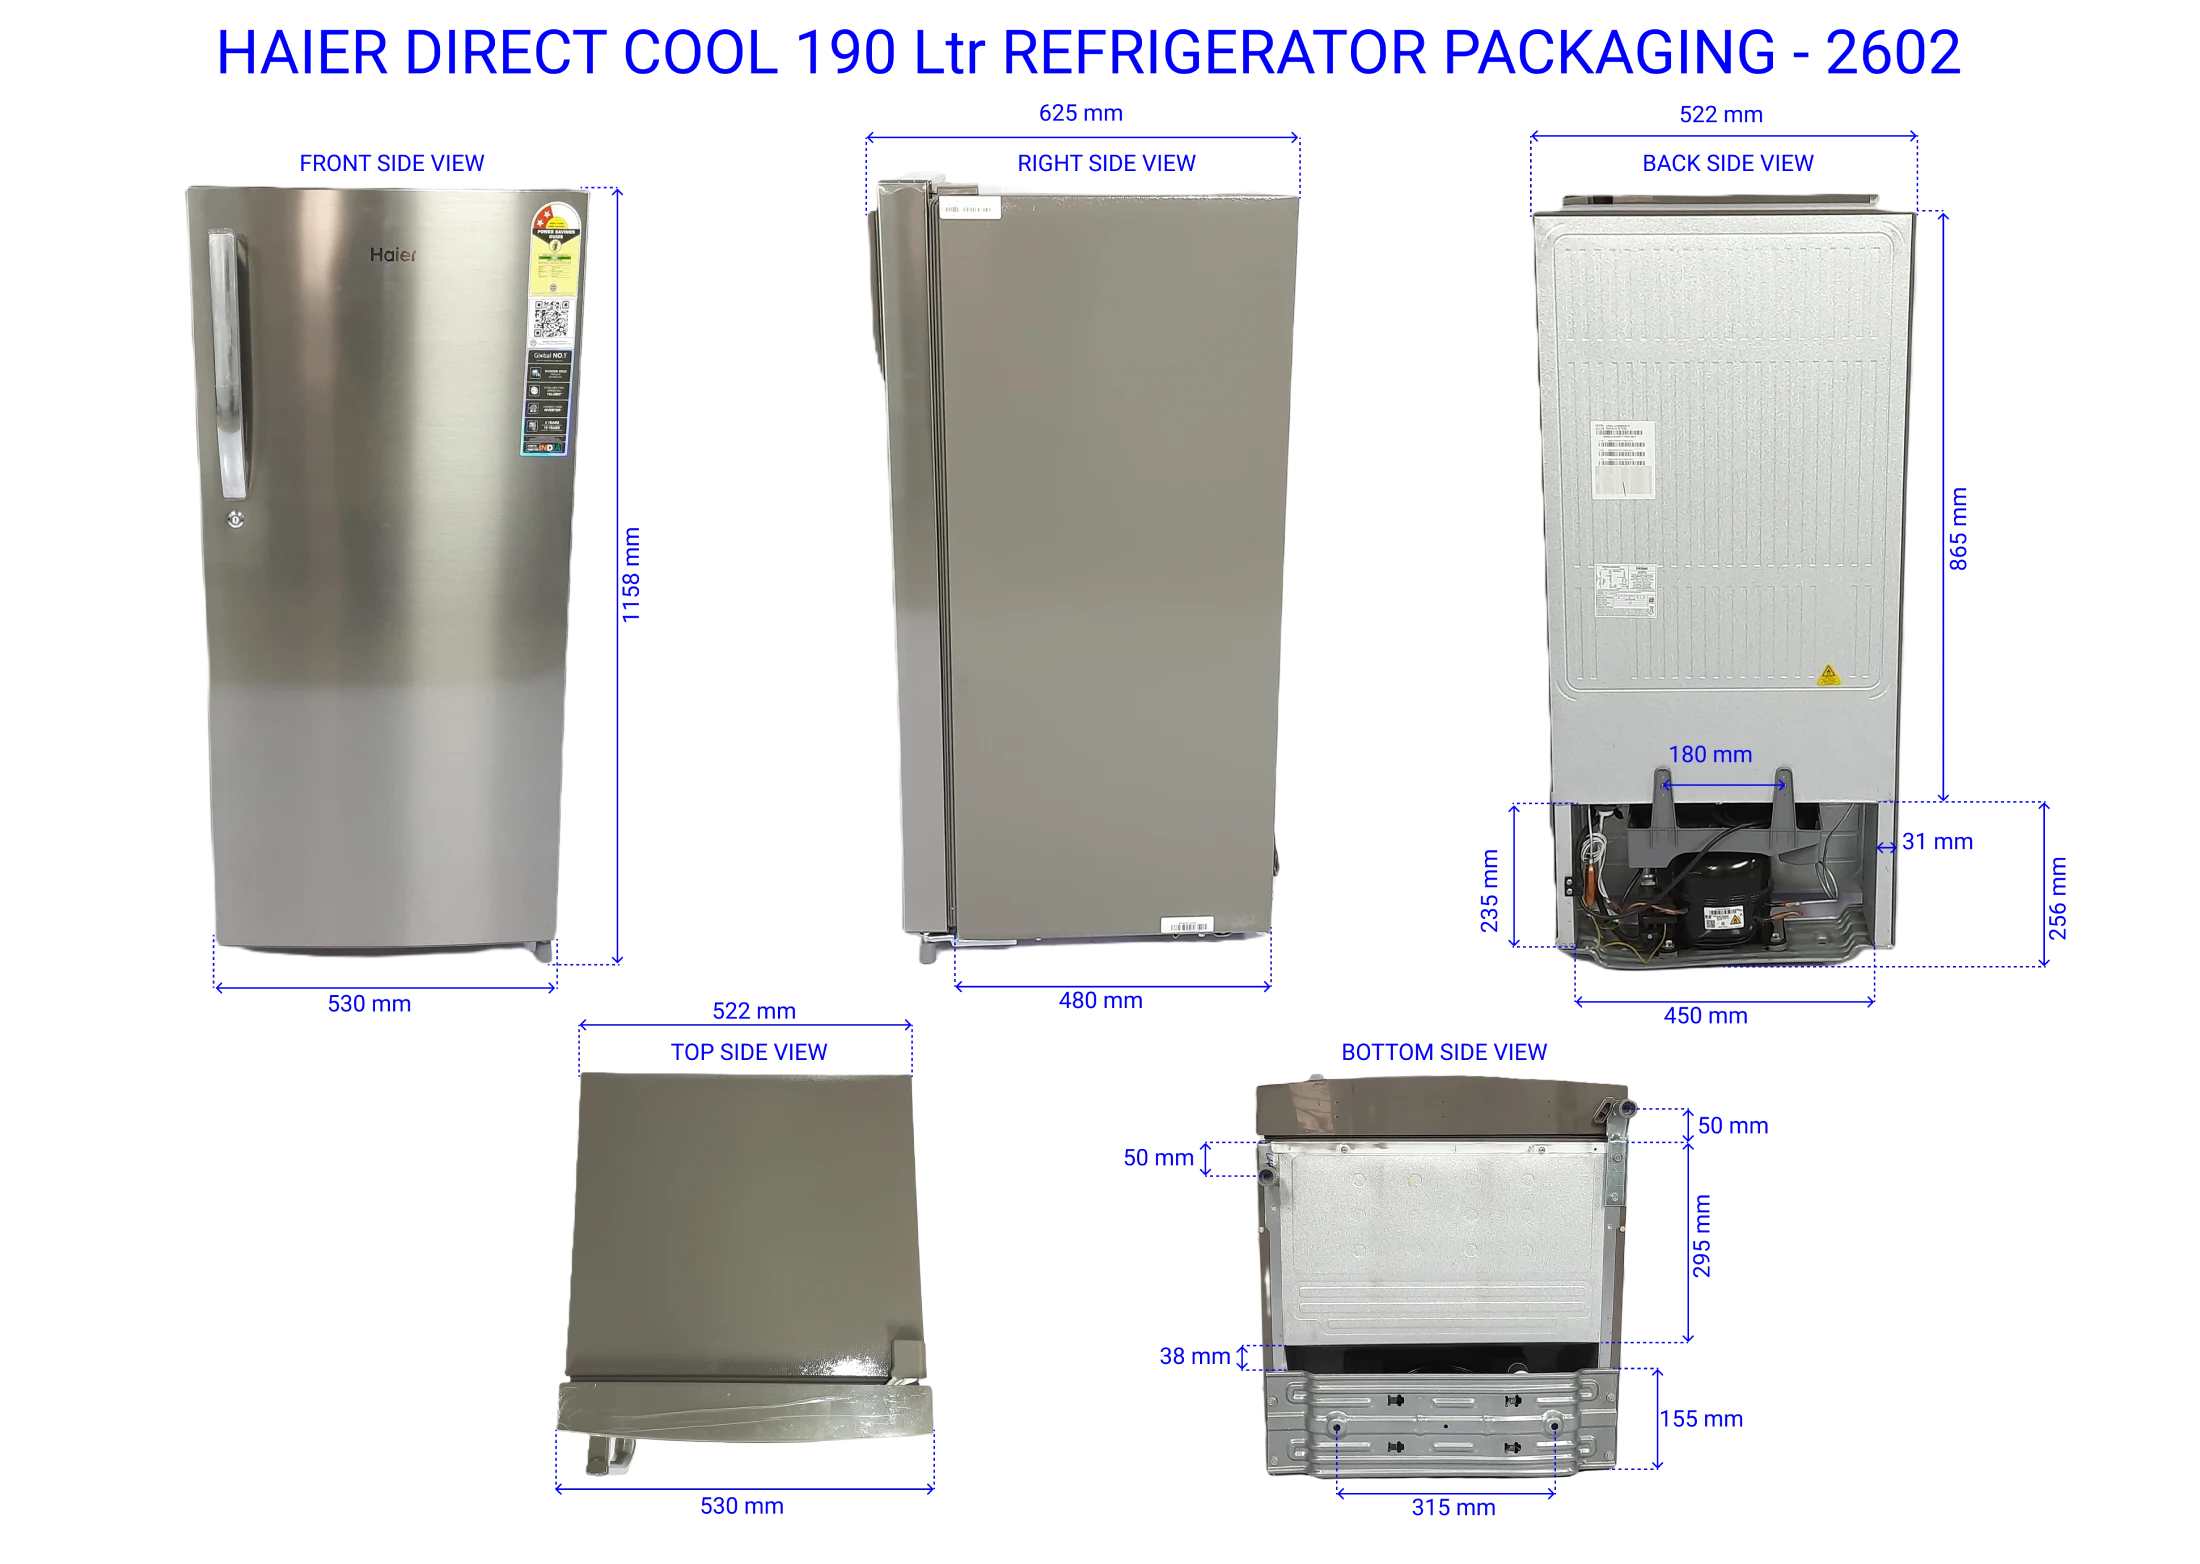
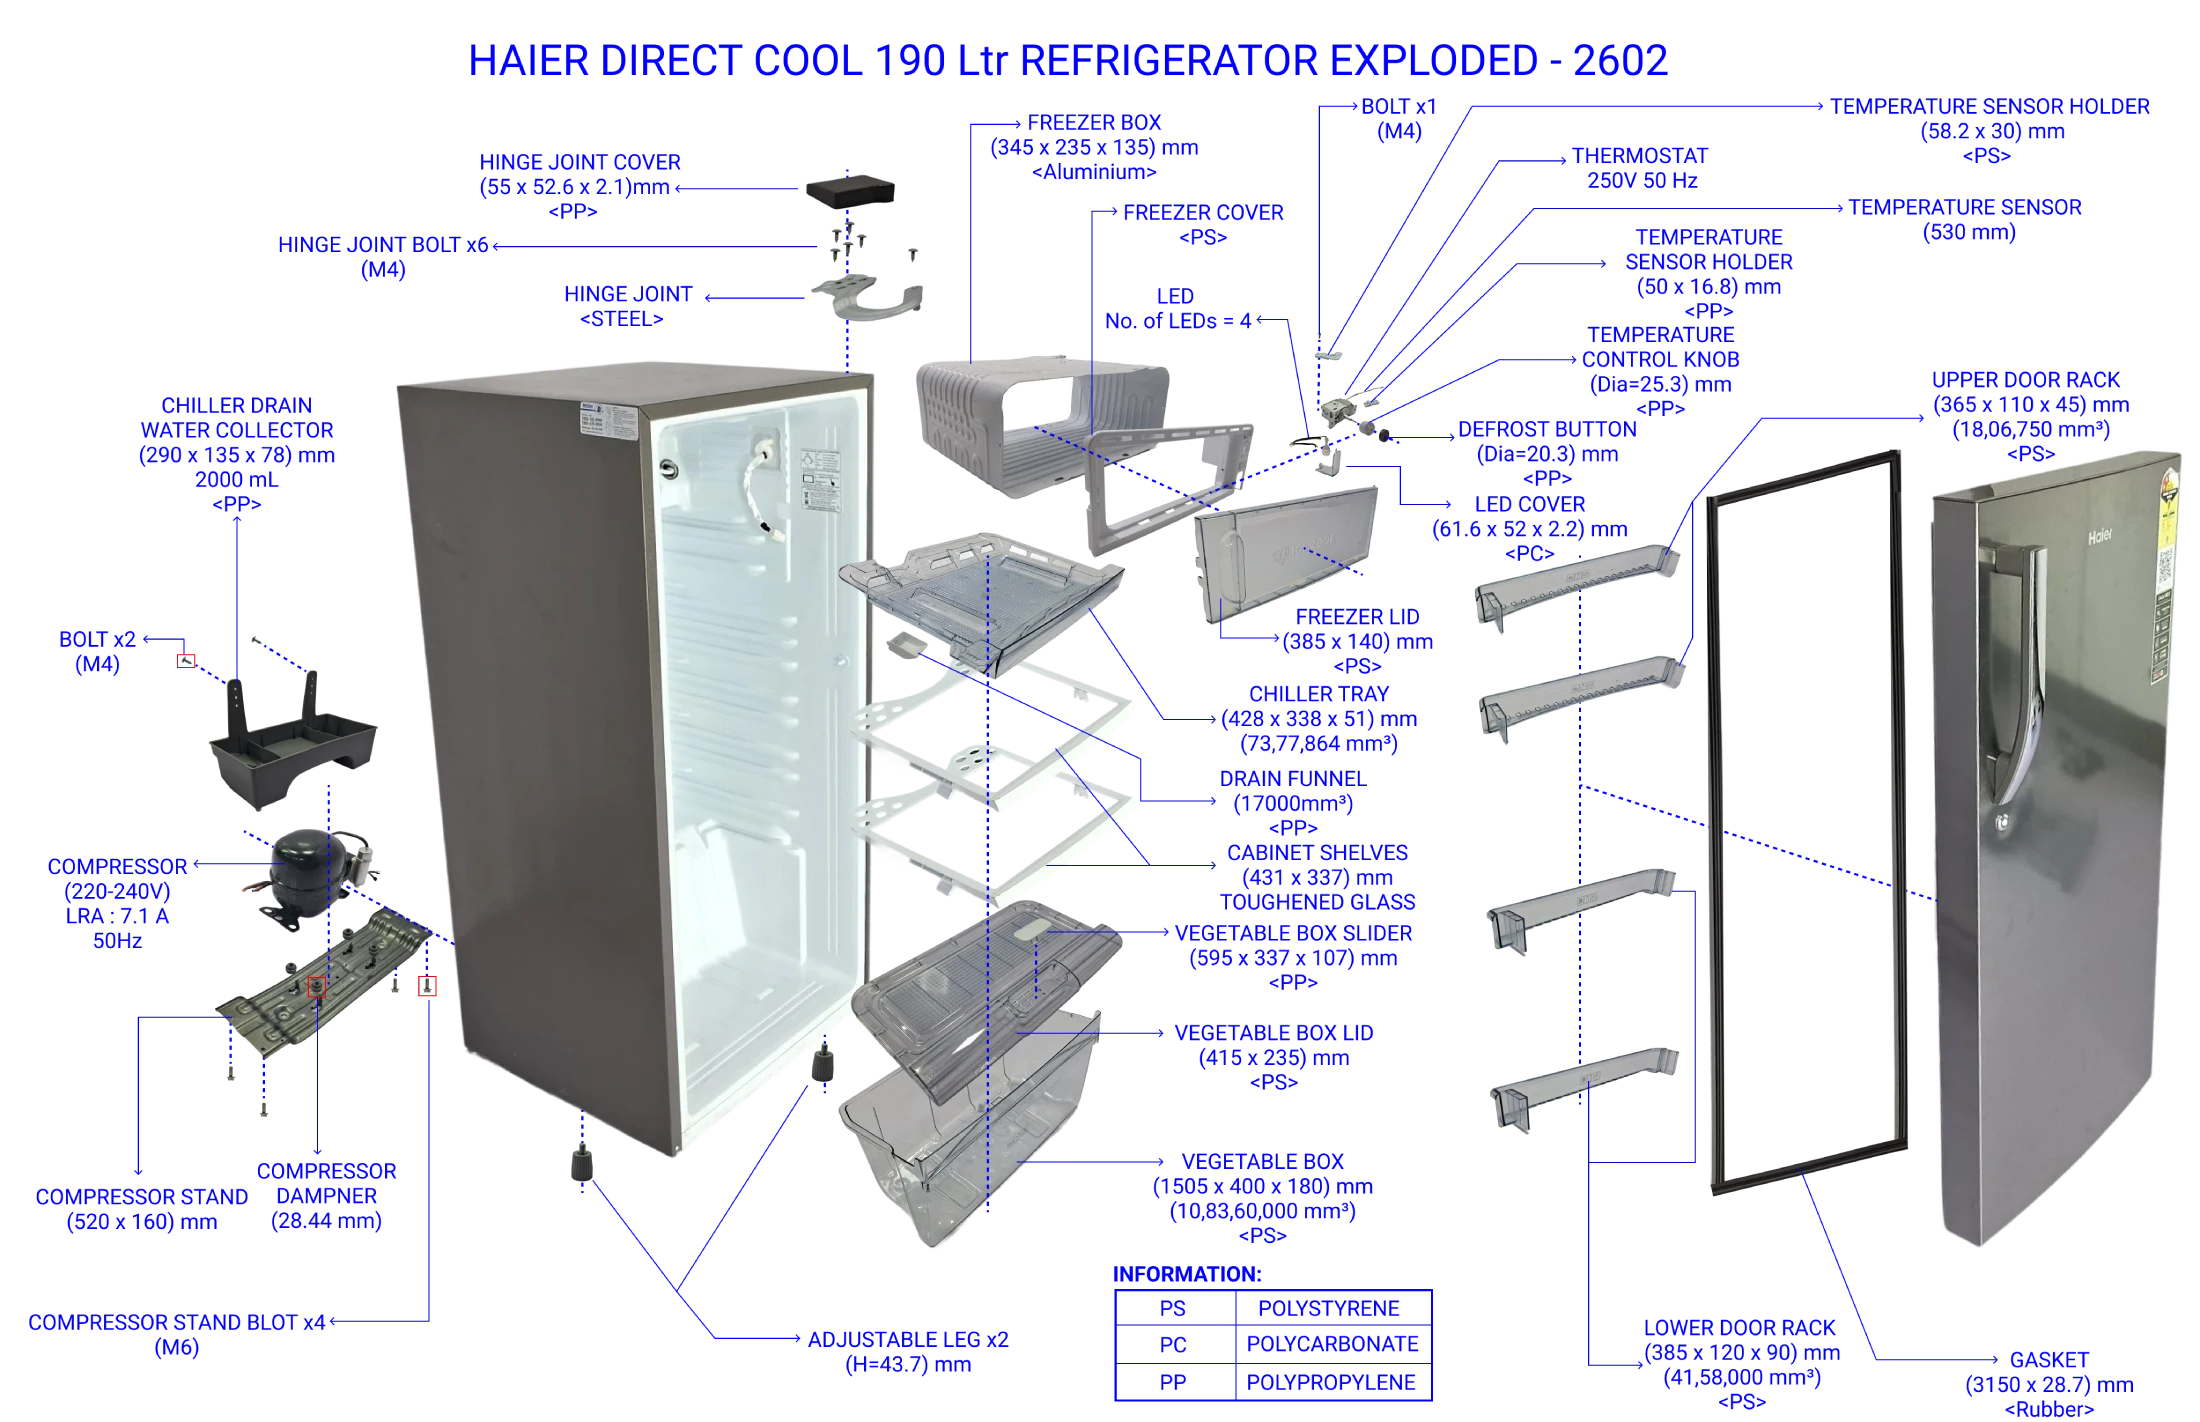
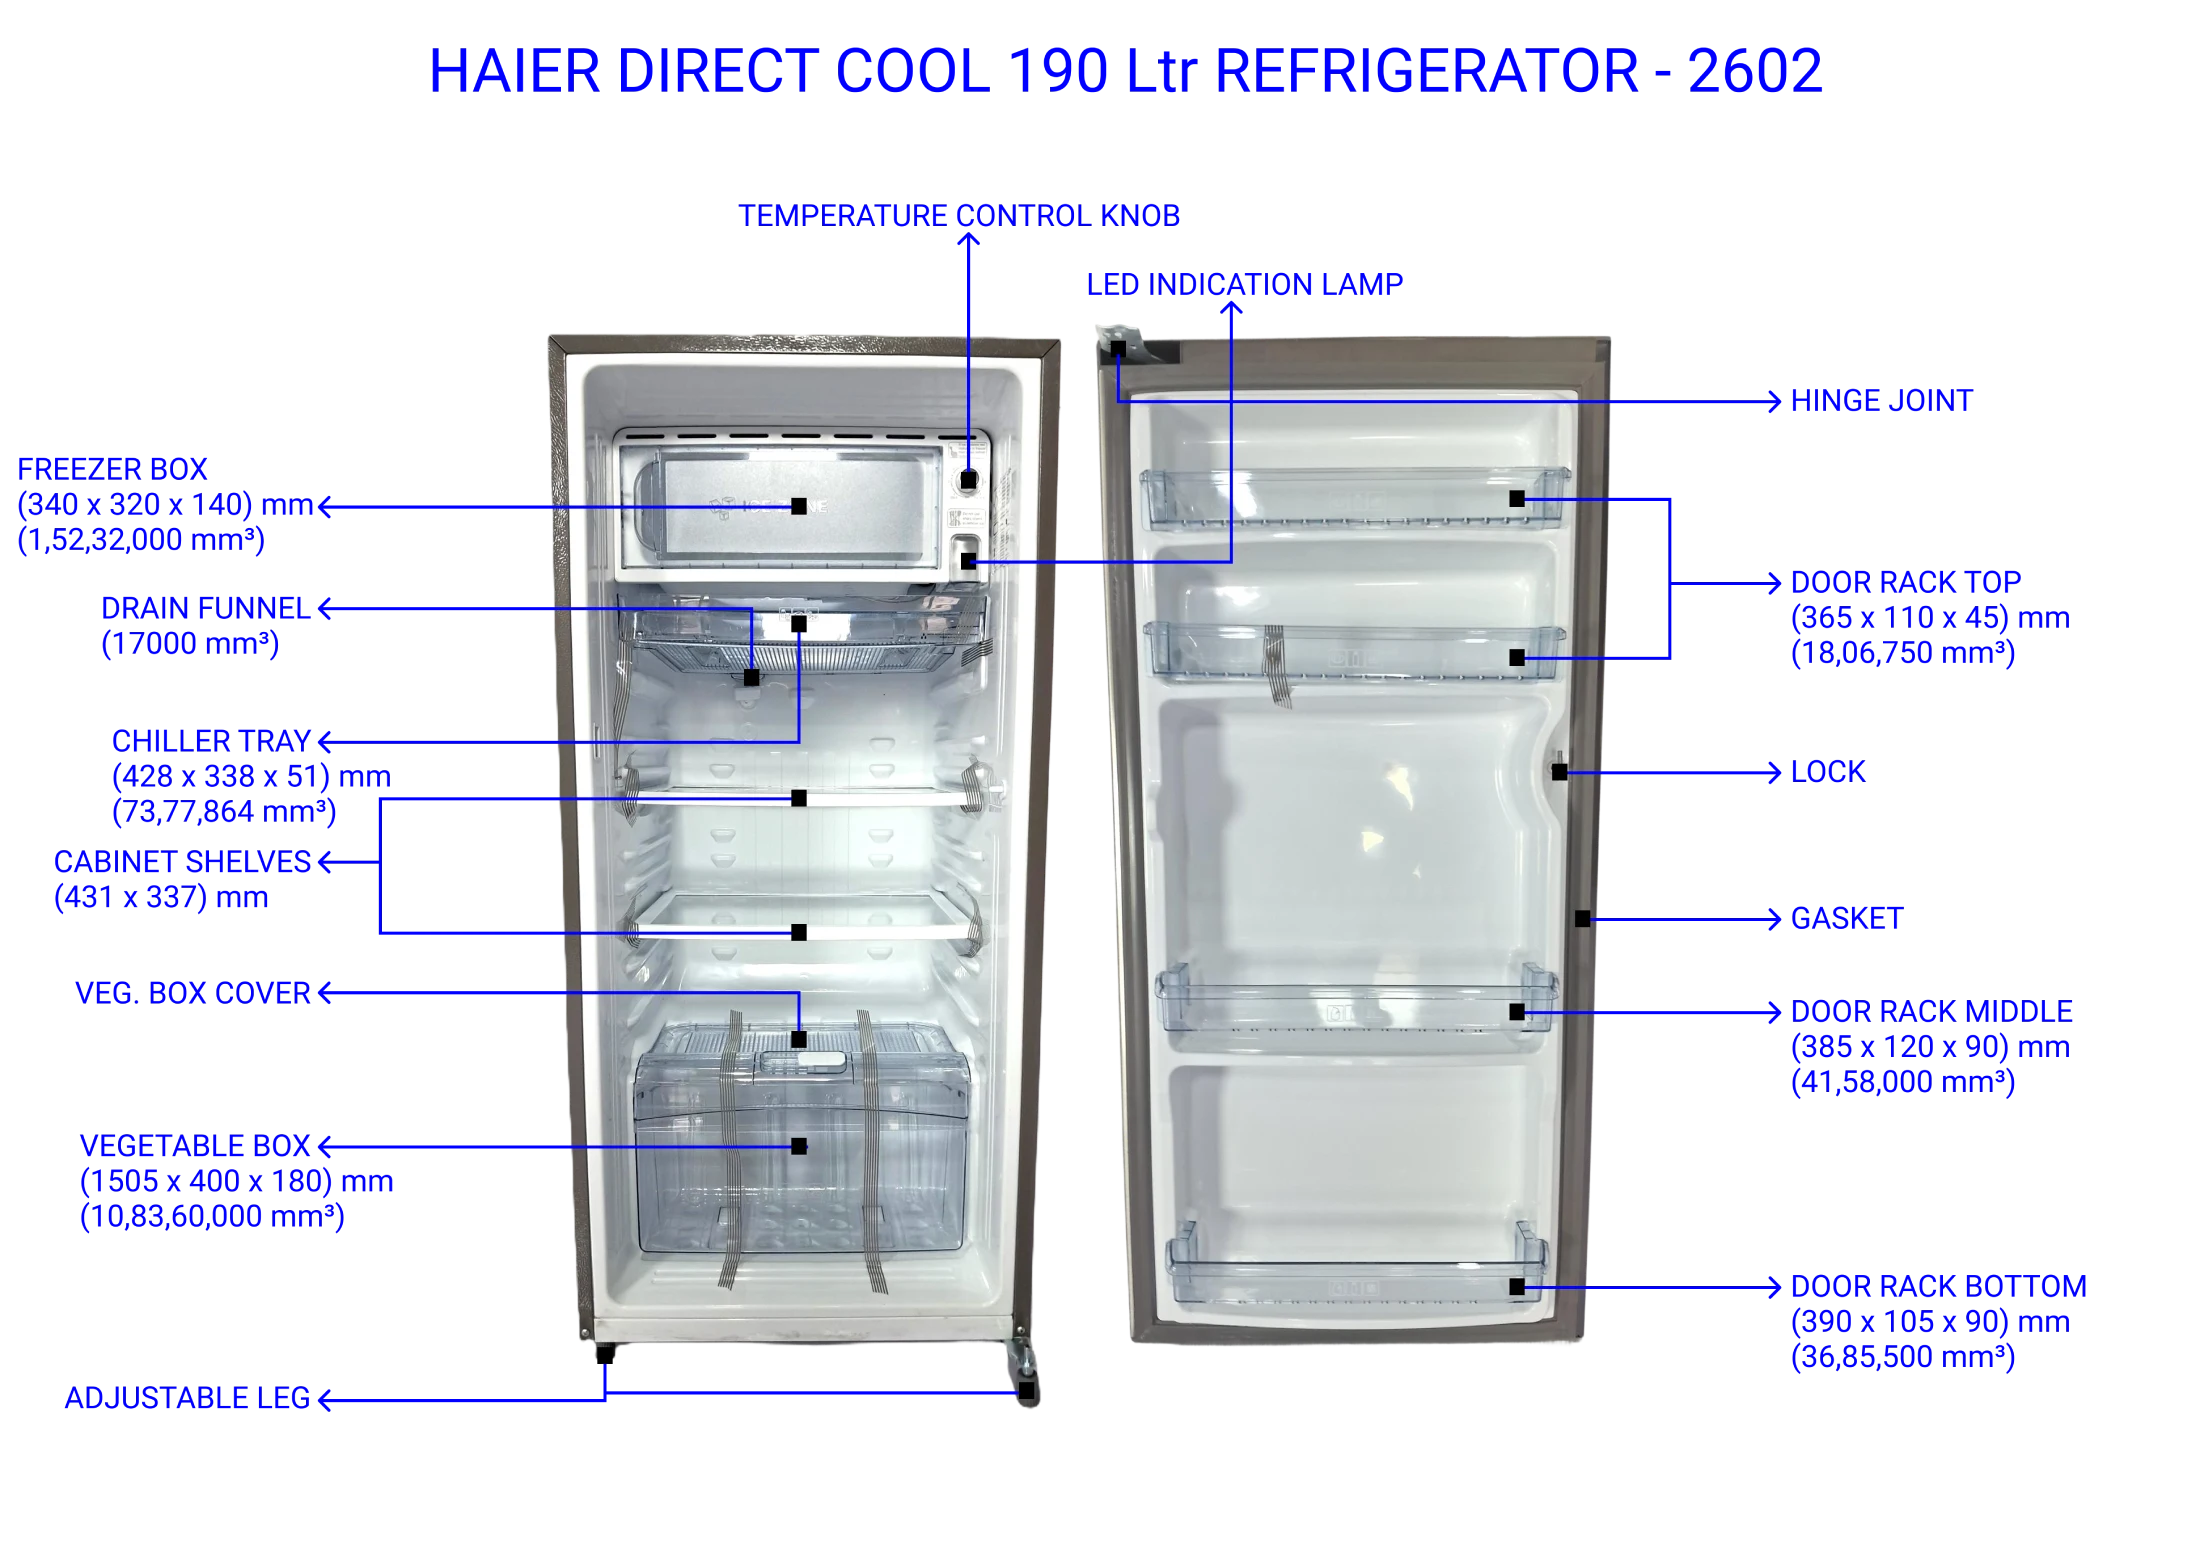
The refrigerator has a total capacity of 190 litres, organized into several compartments. It features a 14-litre freezer with Diamond Edge Technology for efficient ice formation and an 11.5-litre vegetable case covered with a lid measuring 415 235 mm for moisture retention. The main chamber includes two toughened glass shelves, each with a surface area of approximately 145,000 mm, and four door shelves for bottles and condiments. Additionally, it has a chiller tray with a maximum area of 428 338 mm.
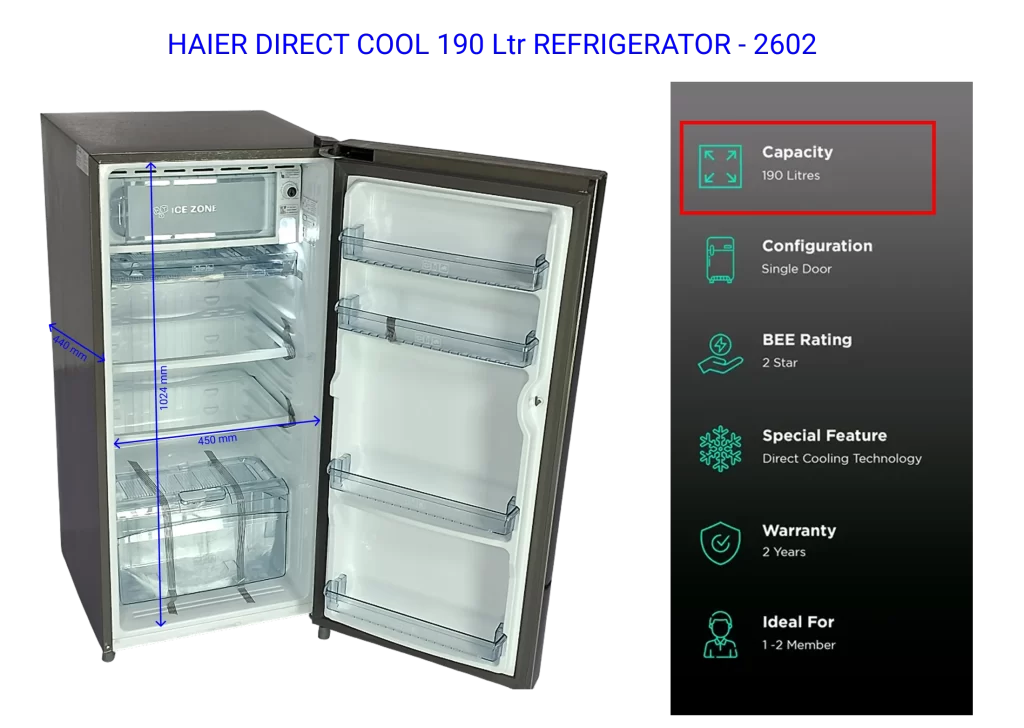
Defrost Water Collection System
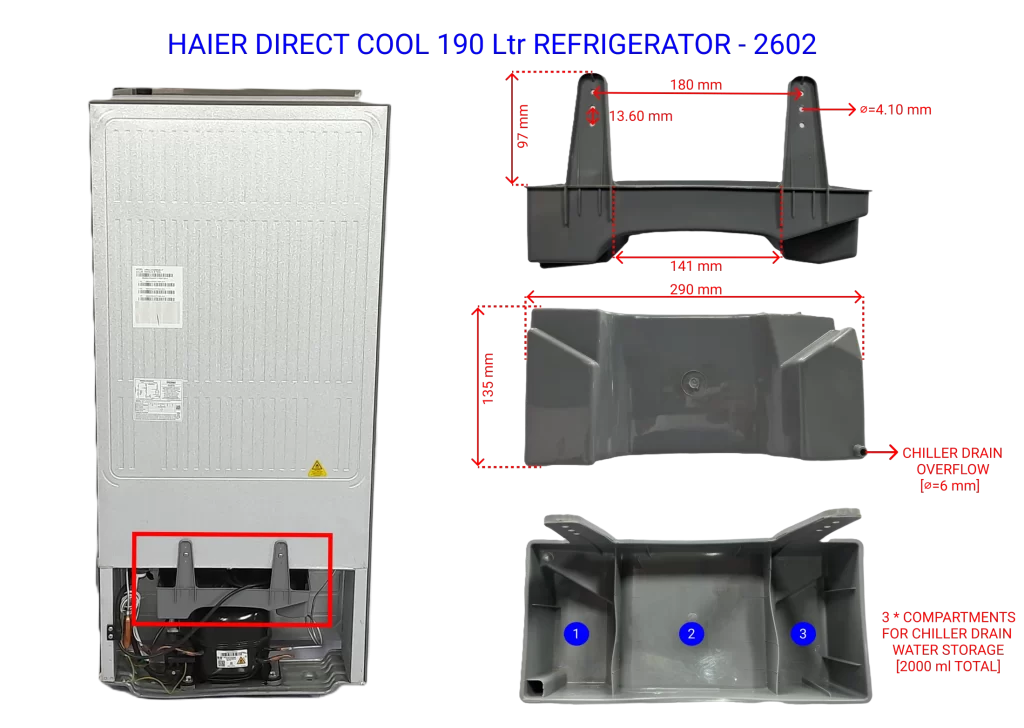
The refrigerator includes a defrost water collection system (Defrosted ice water collector) to prevent water accumulation inside the cabinet. When manual defrosting is performed, the melted ice flows down to the chiller tray, passes through a drain funnel, and is finally collected in a 3-litre water collector located at the rear.
02Cooling Cycle & Compressor
Working of Refrigerator: Cooling Cycle Explained
Below is a detailed breakdown of its design, performance, energy usage, and functional specifications:
If the refrigerator door is open, the door switch closes, turning on the lamp to illuminate the compartment. If the door is closed, the door switch opens and the lamp turns off.
The full cooling cycle operates as follows:
- Power Supply: Power is supplied through the plug connected to the AC mains (black = live, red = neutral, green/yellow = earth)
- Door Switch Operation: If the door is open, the switch closes and turns on the lamp. If closed, the lamp turns off
- Thermostat Operation: Monitors internal temperature; remains open when cooling is not needed
- Relay and Start Capacitor: When temperature rises above set point, thermostat closes, relay connects start winding and capacitor to assist motor start
- Refrigerant Compression: Compressor compresses low-pressure gas from evaporator into high-pressure, high-temperature gas
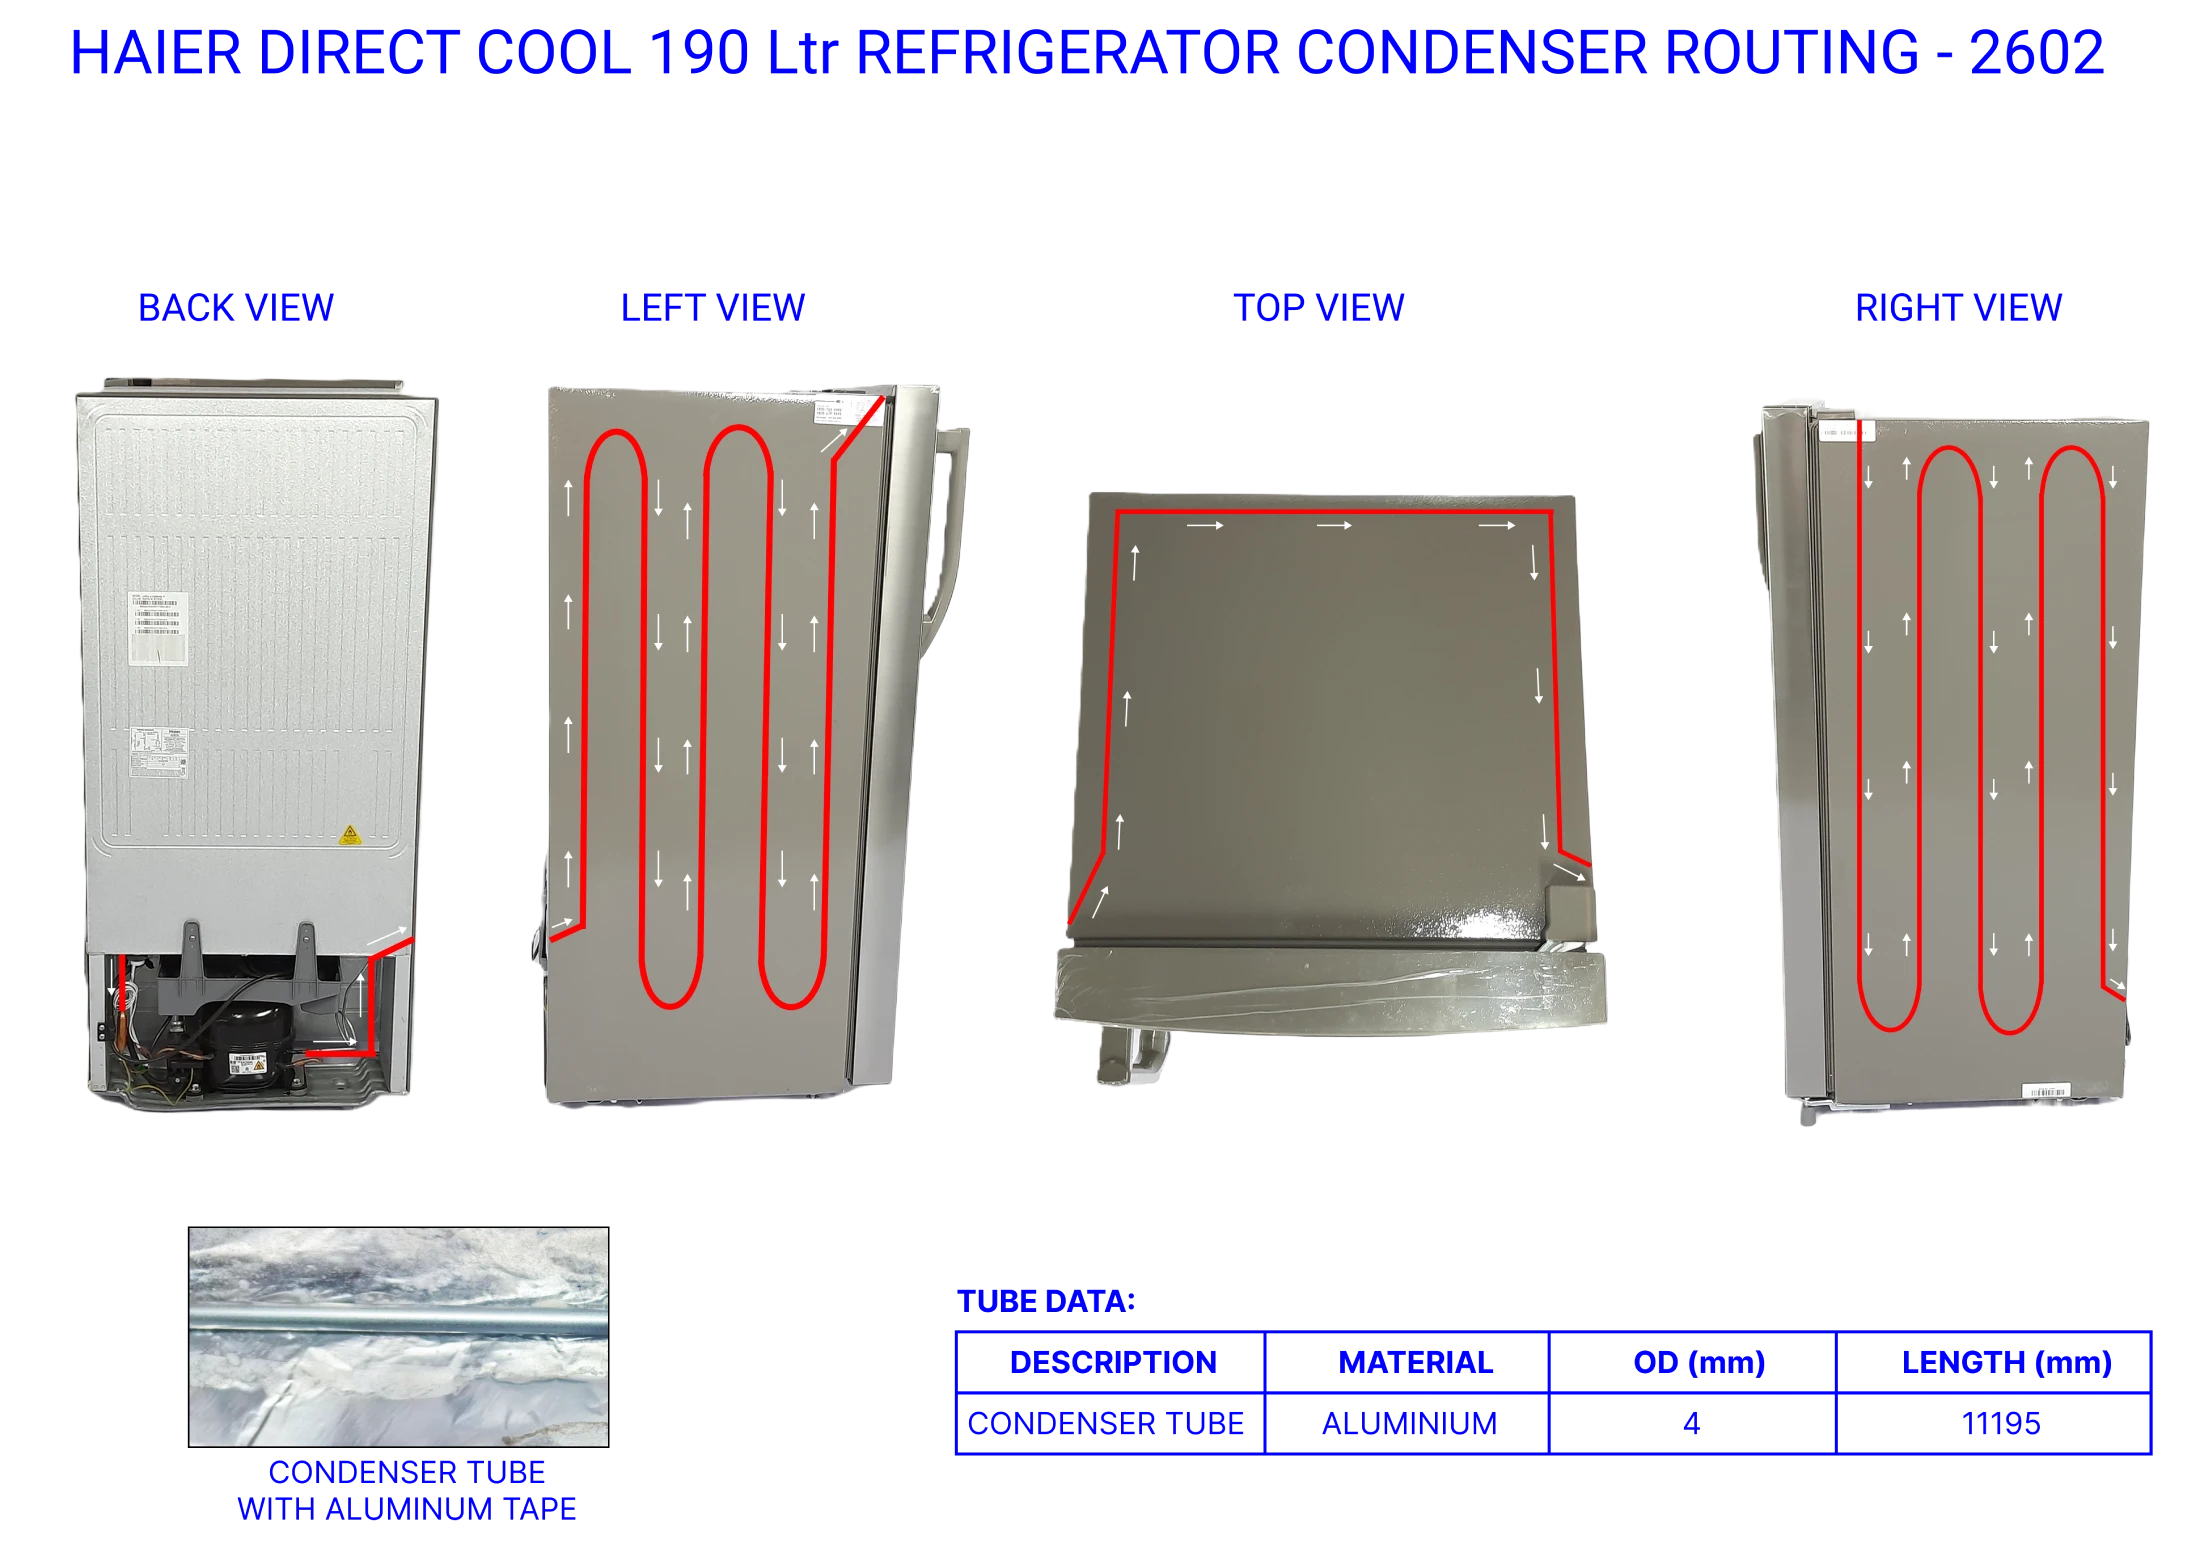
- Condensation: Hot gas flows through condenser coils, releases heat, and condenses into liquid
- Pressure Drop: Liquid refrigerant passes through capillary tube, pressure and temperature drop significantly
- Evaporation: Cold, low-pressure refrigerant enters evaporator coil and evaporates by absorbing heat from inside
- Refrigerant Returns: Low-pressure gas returns to compressor to begin cycle again
- Cycle Control: Thermostat opens when desired temperature is reached, stopping compressor
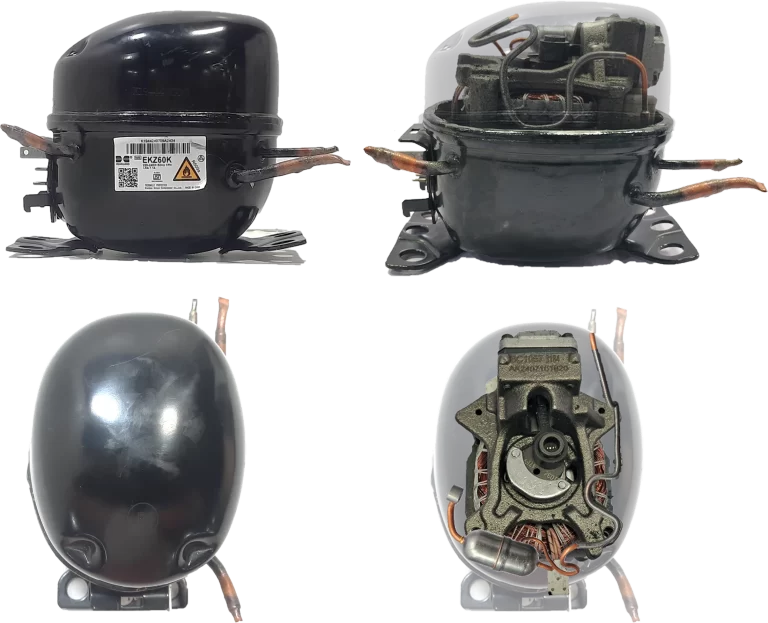
Compressor Working Principle
When the fridge temperature rises above the set point, the thermostat closes, allowing power to flow to the compressor circuit. The relay is energized and temporarily connects the start winding and capacitor to assist in starting the compressor motor. The start capacitor provides a phase shift, helping the compressor motor generate enough torque to start. Once the motor reaches sufficient speed, the relay automatically disconnects the start winding, and the compressor continues to run on the main winding alone.
When the fridge temperature rises above the set point, the thermostat closes, allowing 220---240V AC to power the single-phase motor inside the compressor.
The stator generates a rotating magnetic field that spins the rotor (2. Rotor Starts Rotating) ( 51.5 mm), initiating the compressor cycle.
The rotor motion drives the crankshaft (121.5 mm long), converting rotary motion into reciprocating motion through the connecting rod (52.6 mm).
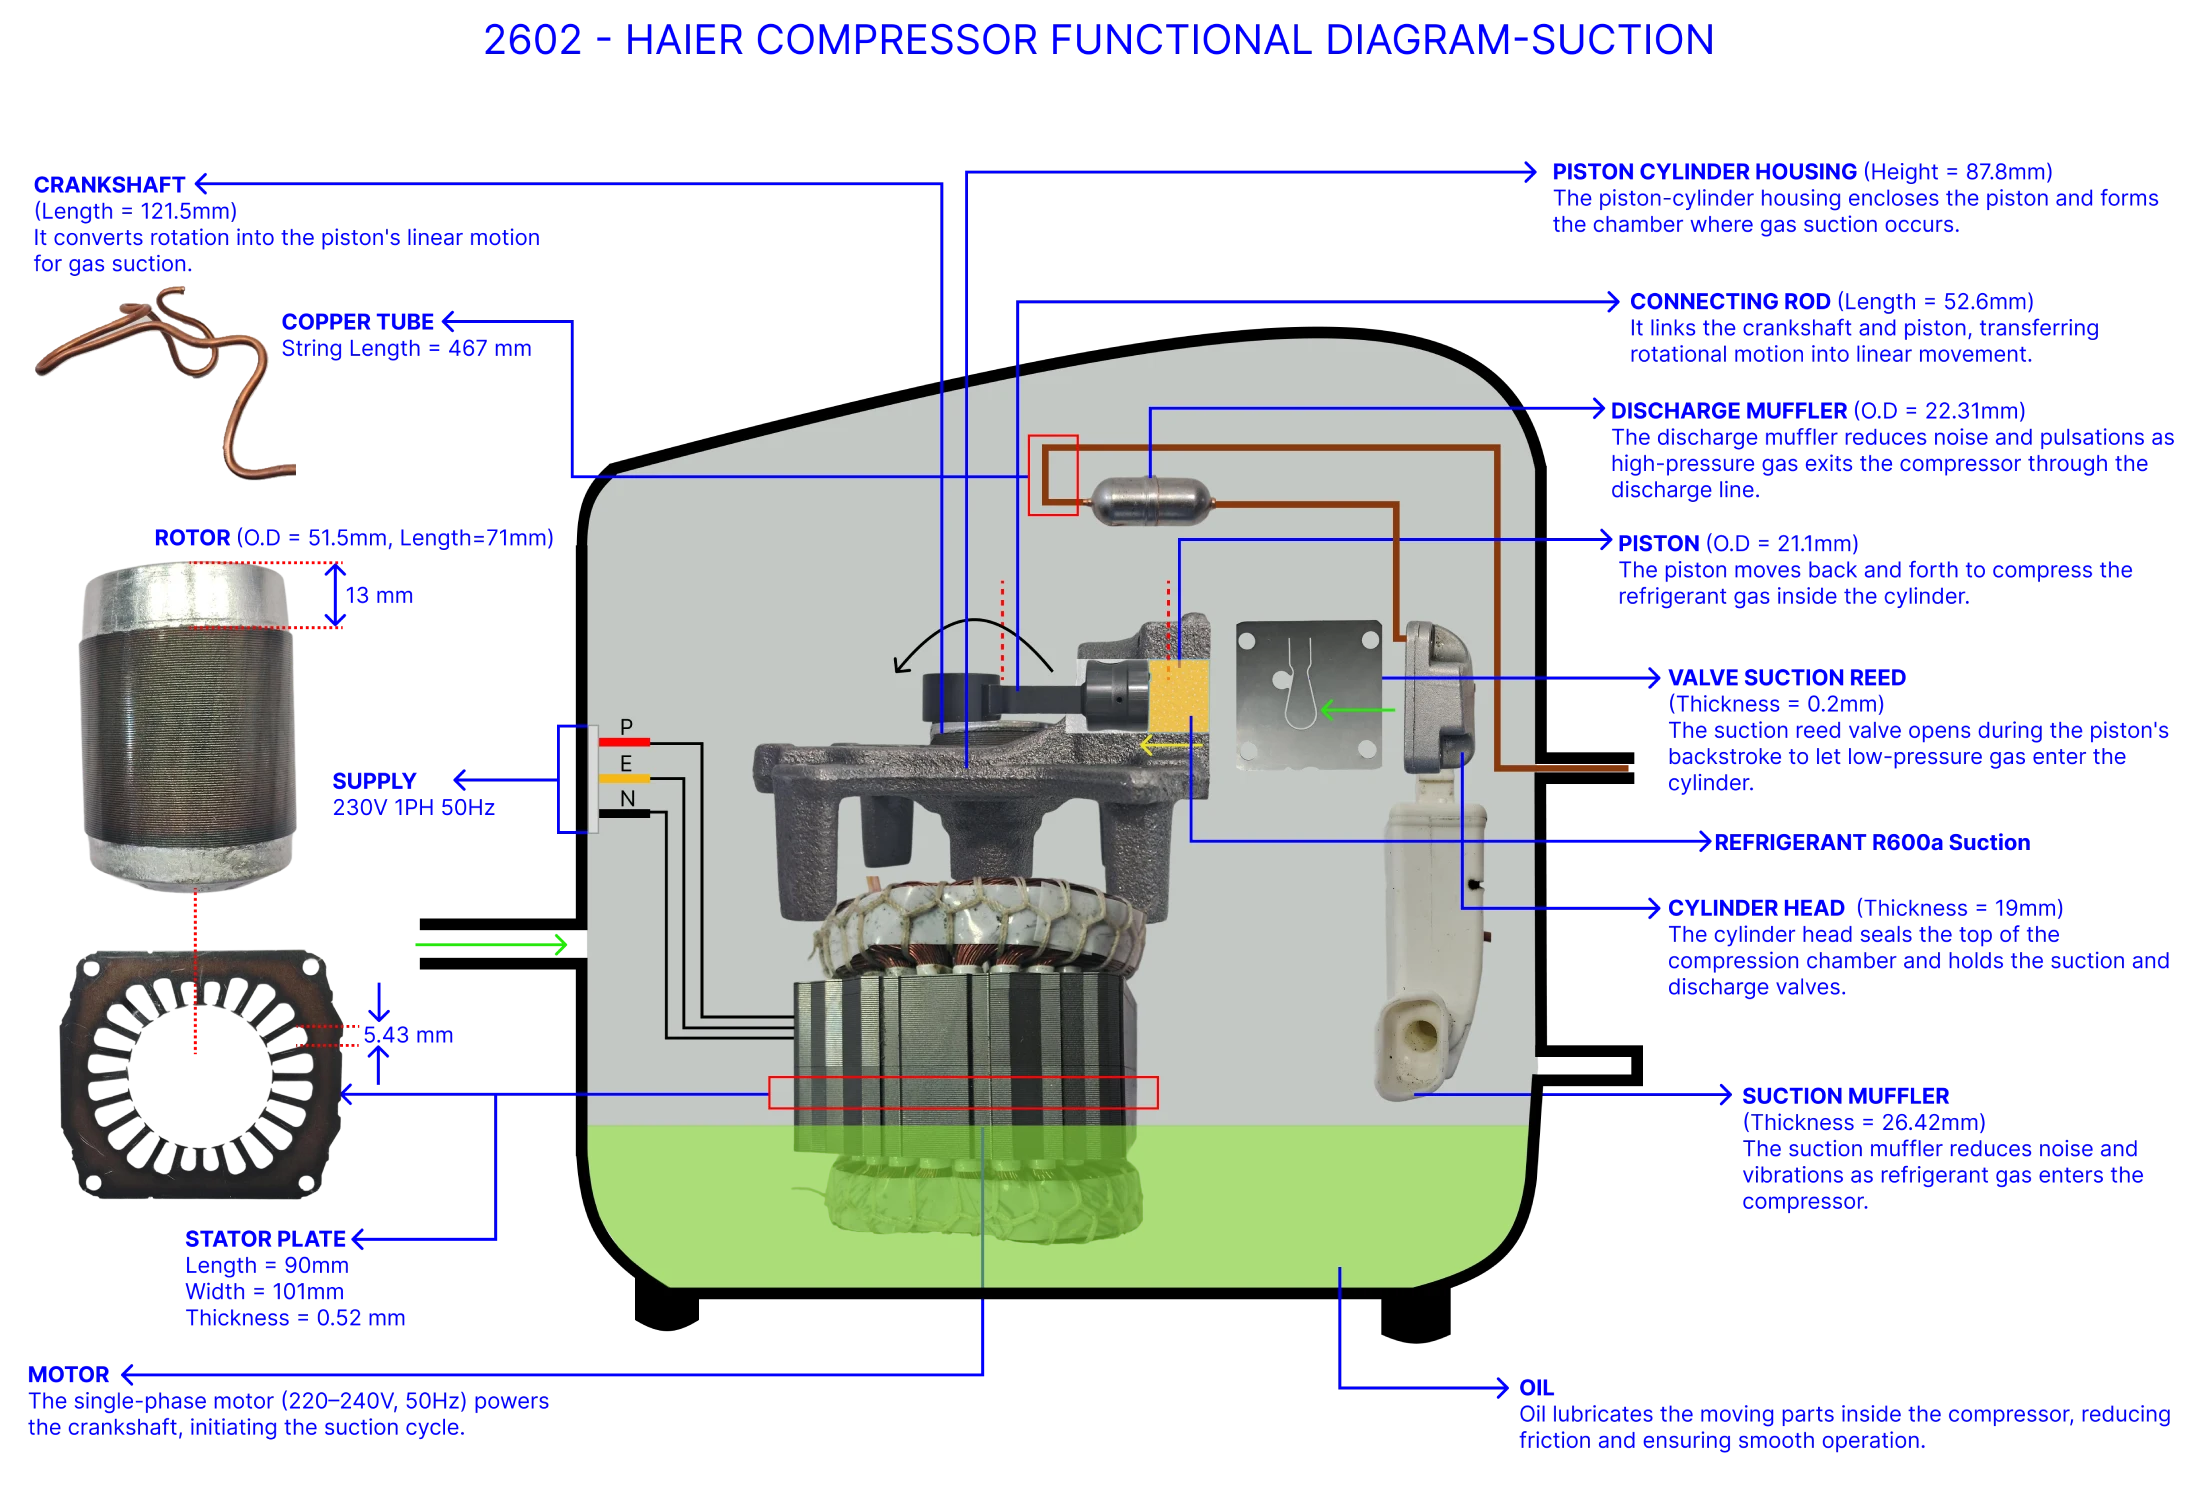
Suction Stroke (Downstroke)
The crankshaft pulls the piston (4. Piston Moves Downward) ( 21.1 mm) down inside the cylinder (87.8 mm height), increasing chamber volume and reducing internal pressure.
The pressure drop causes the suction reed valve (0.2 mm thick) to open, allowing low-pressure R600a refrigerant to enter the chamber.
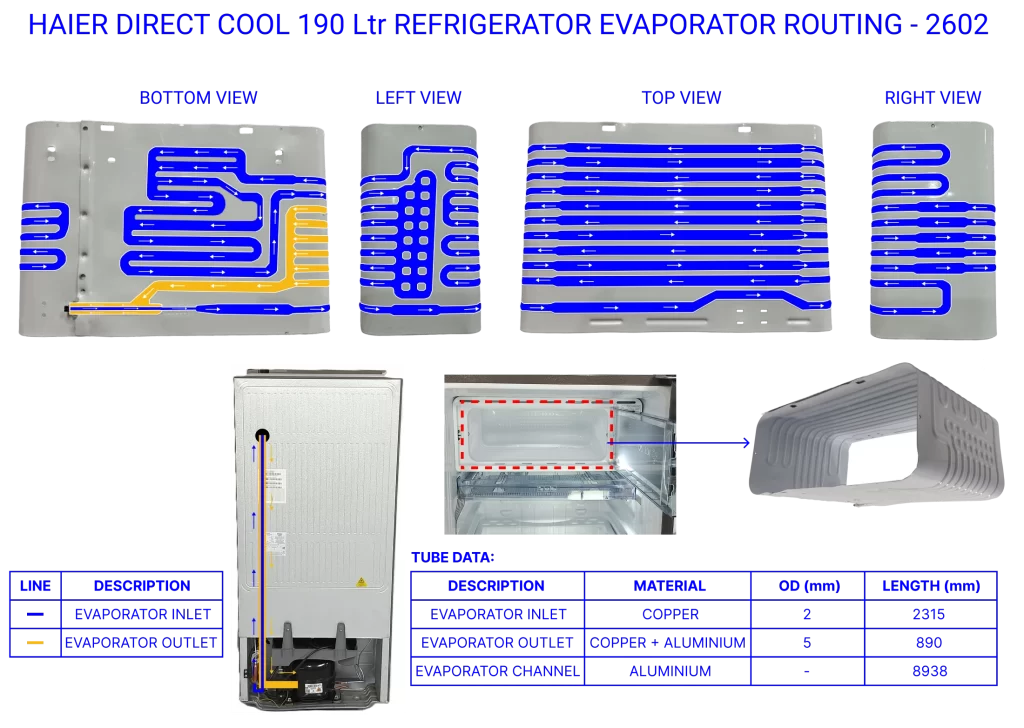
Refrigerant flows in through the suction muffler (26.42 mm thick), which dampens intake noise and vibrations.
As the crankshaft rotates, it agitates the oil pool at the bottom. The motion splashes oil onto the piston skirt, cylinder walls, crankshaft, and connecting rod.
Oil forms a lubricating film between the piston and cylinder, reducing friction, sealing against leakage, and minimizing heat and wear.
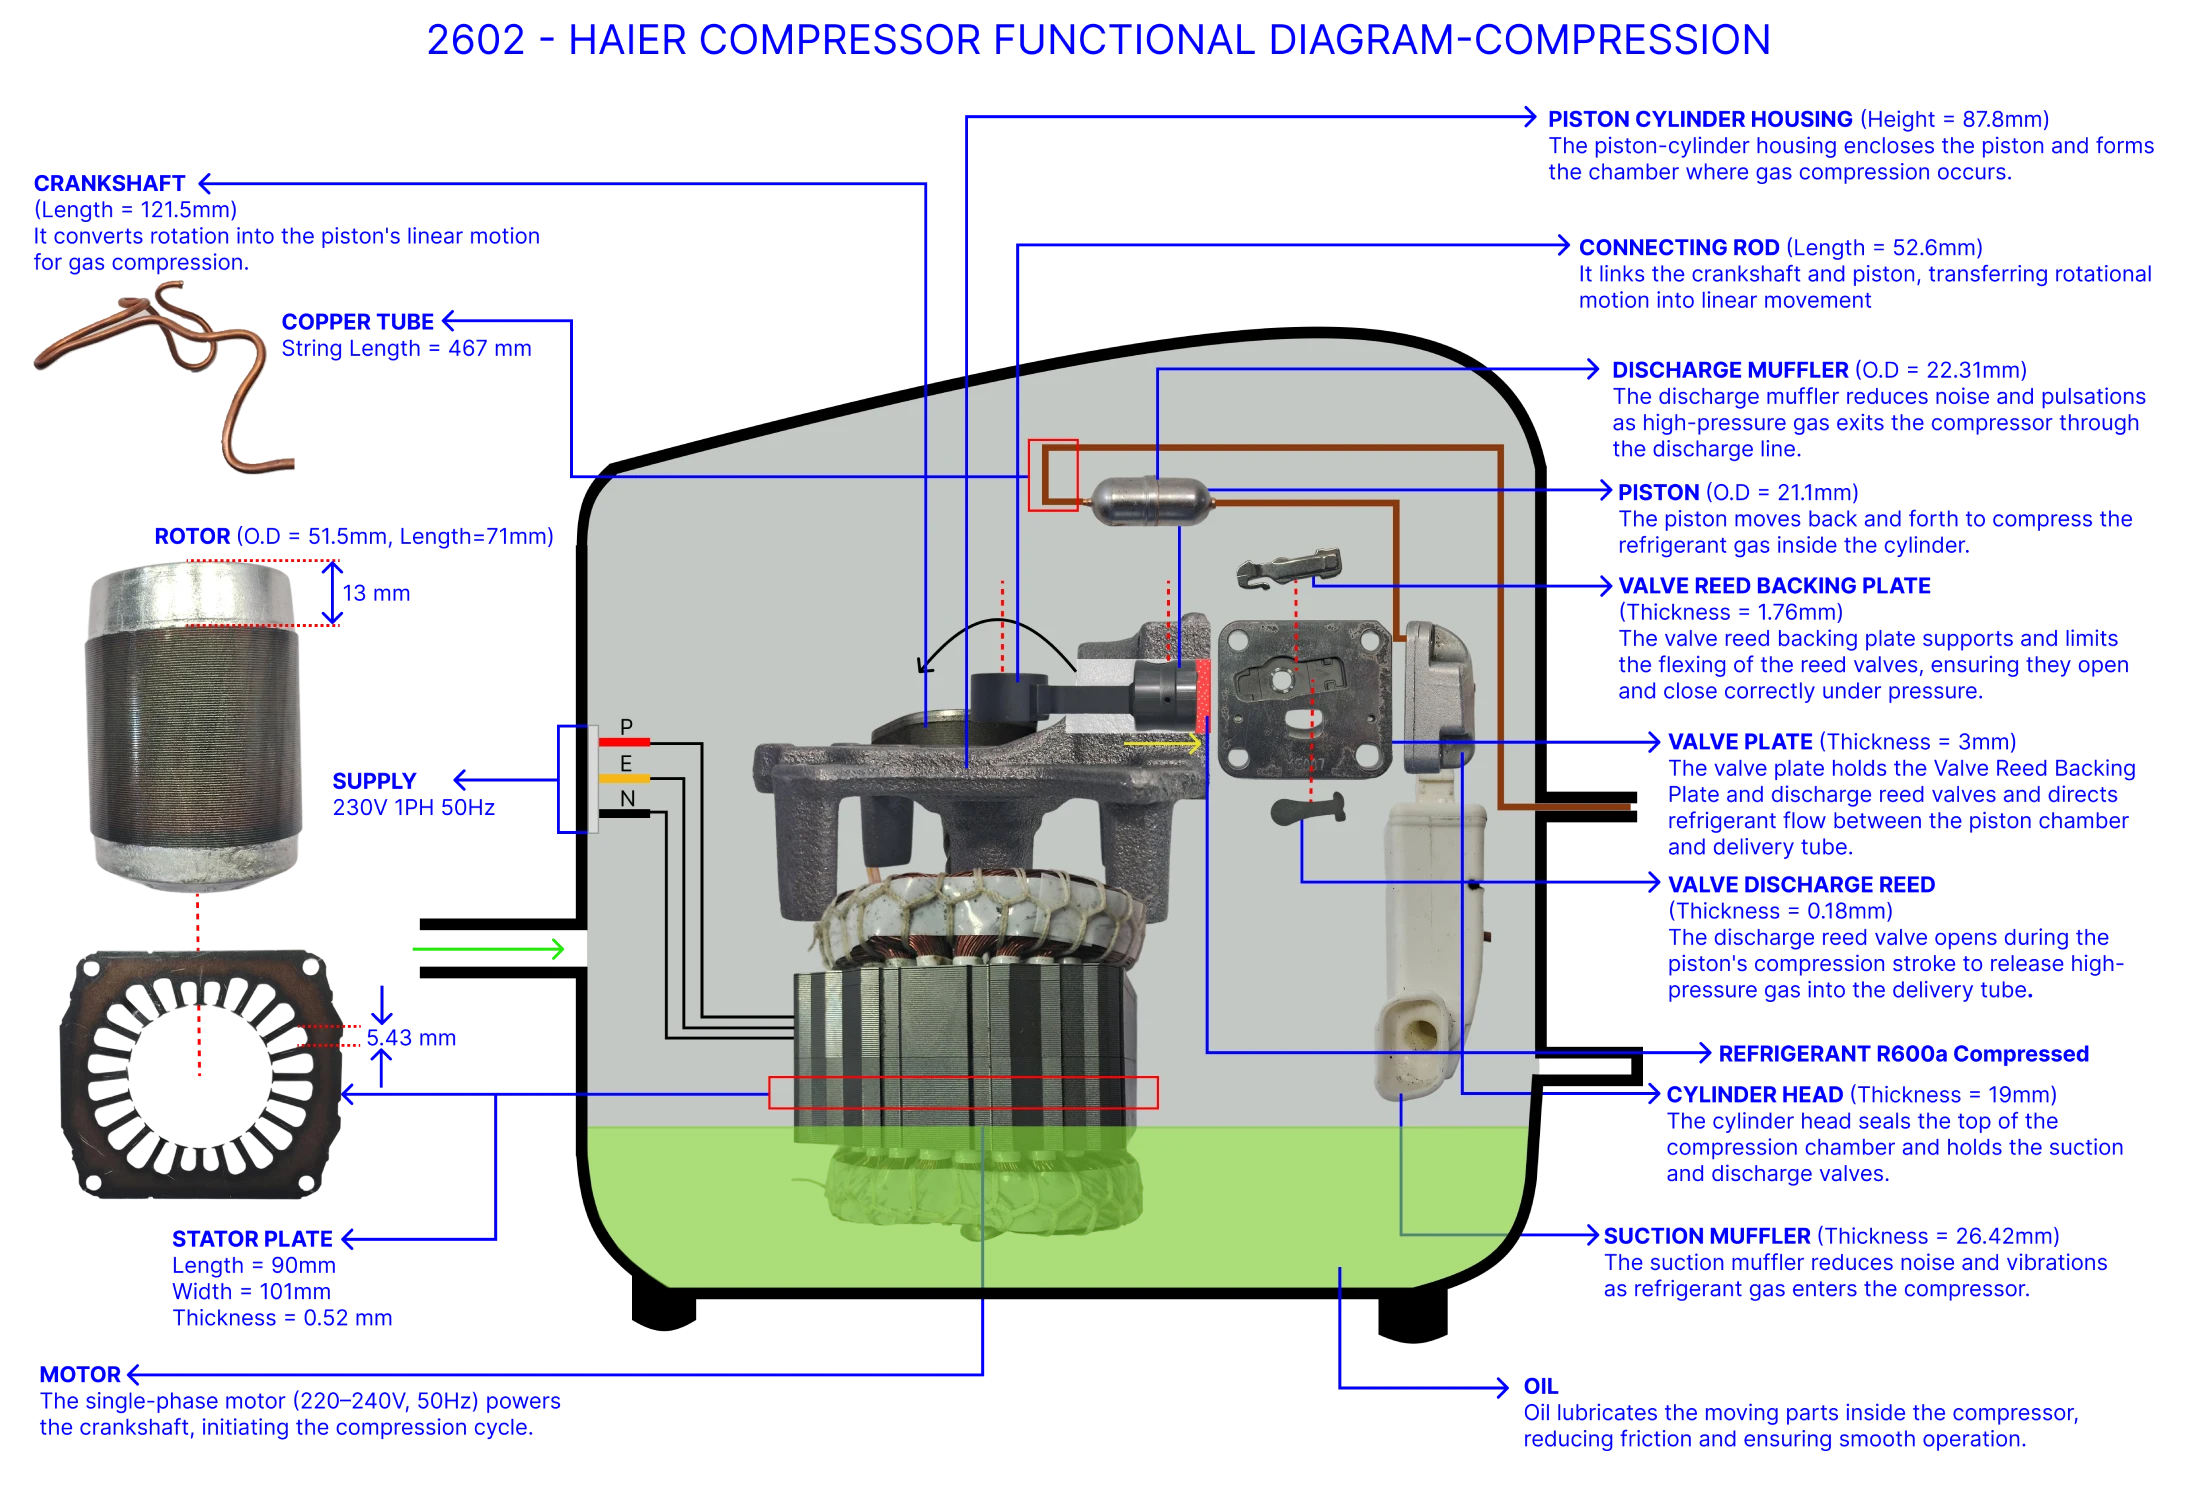
Compression Stroke (Upstroke)
The crankshaft pushes the piston upward (9. Piston Moves Upward), decreasing chamber volume and increasing pressure.
The rising pressure forces the suction valve to close, preventing backflow.
The refrigerant vapor is compressed into high-pressure, high-temperature gas suitable for heat rejection in the condenser.
Once internal pressure exceeds that of the discharge line, the discharge reed valve (0.18 mm thick) opens.
Compressed gas exits via the discharge muffler ( 22.31 mm), which smooths out pulsations and reduces discharge noise. A 3 mm valve plate (14. Valves Controlled by Valve Plate) and 1.76 mm backing plate guide and limit reed valve motion, ensuring timely opening/closing based on pressure changes.
With each rotation, oil continues circulating, maintaining lubrication. The cycle repeats until the thermostat cuts power when the target temperature is reached.
03BOM & Weight Analysis
The following table outlines key parts, their materials, approximate weights, and functions derived from teardown data:
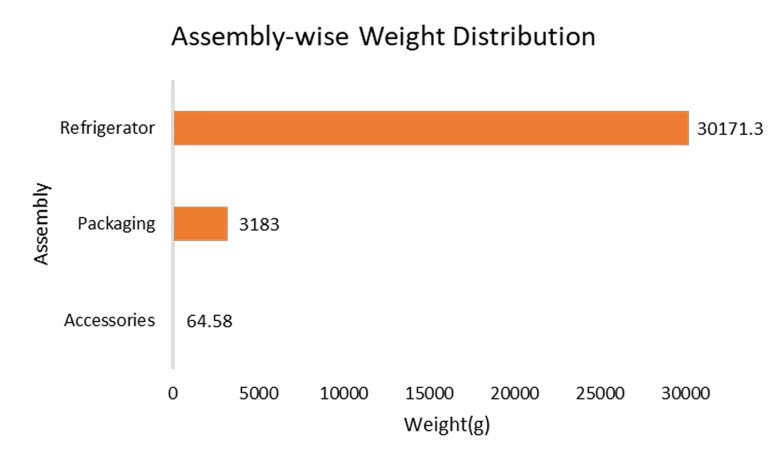
Assembly-wise Weight Distribution
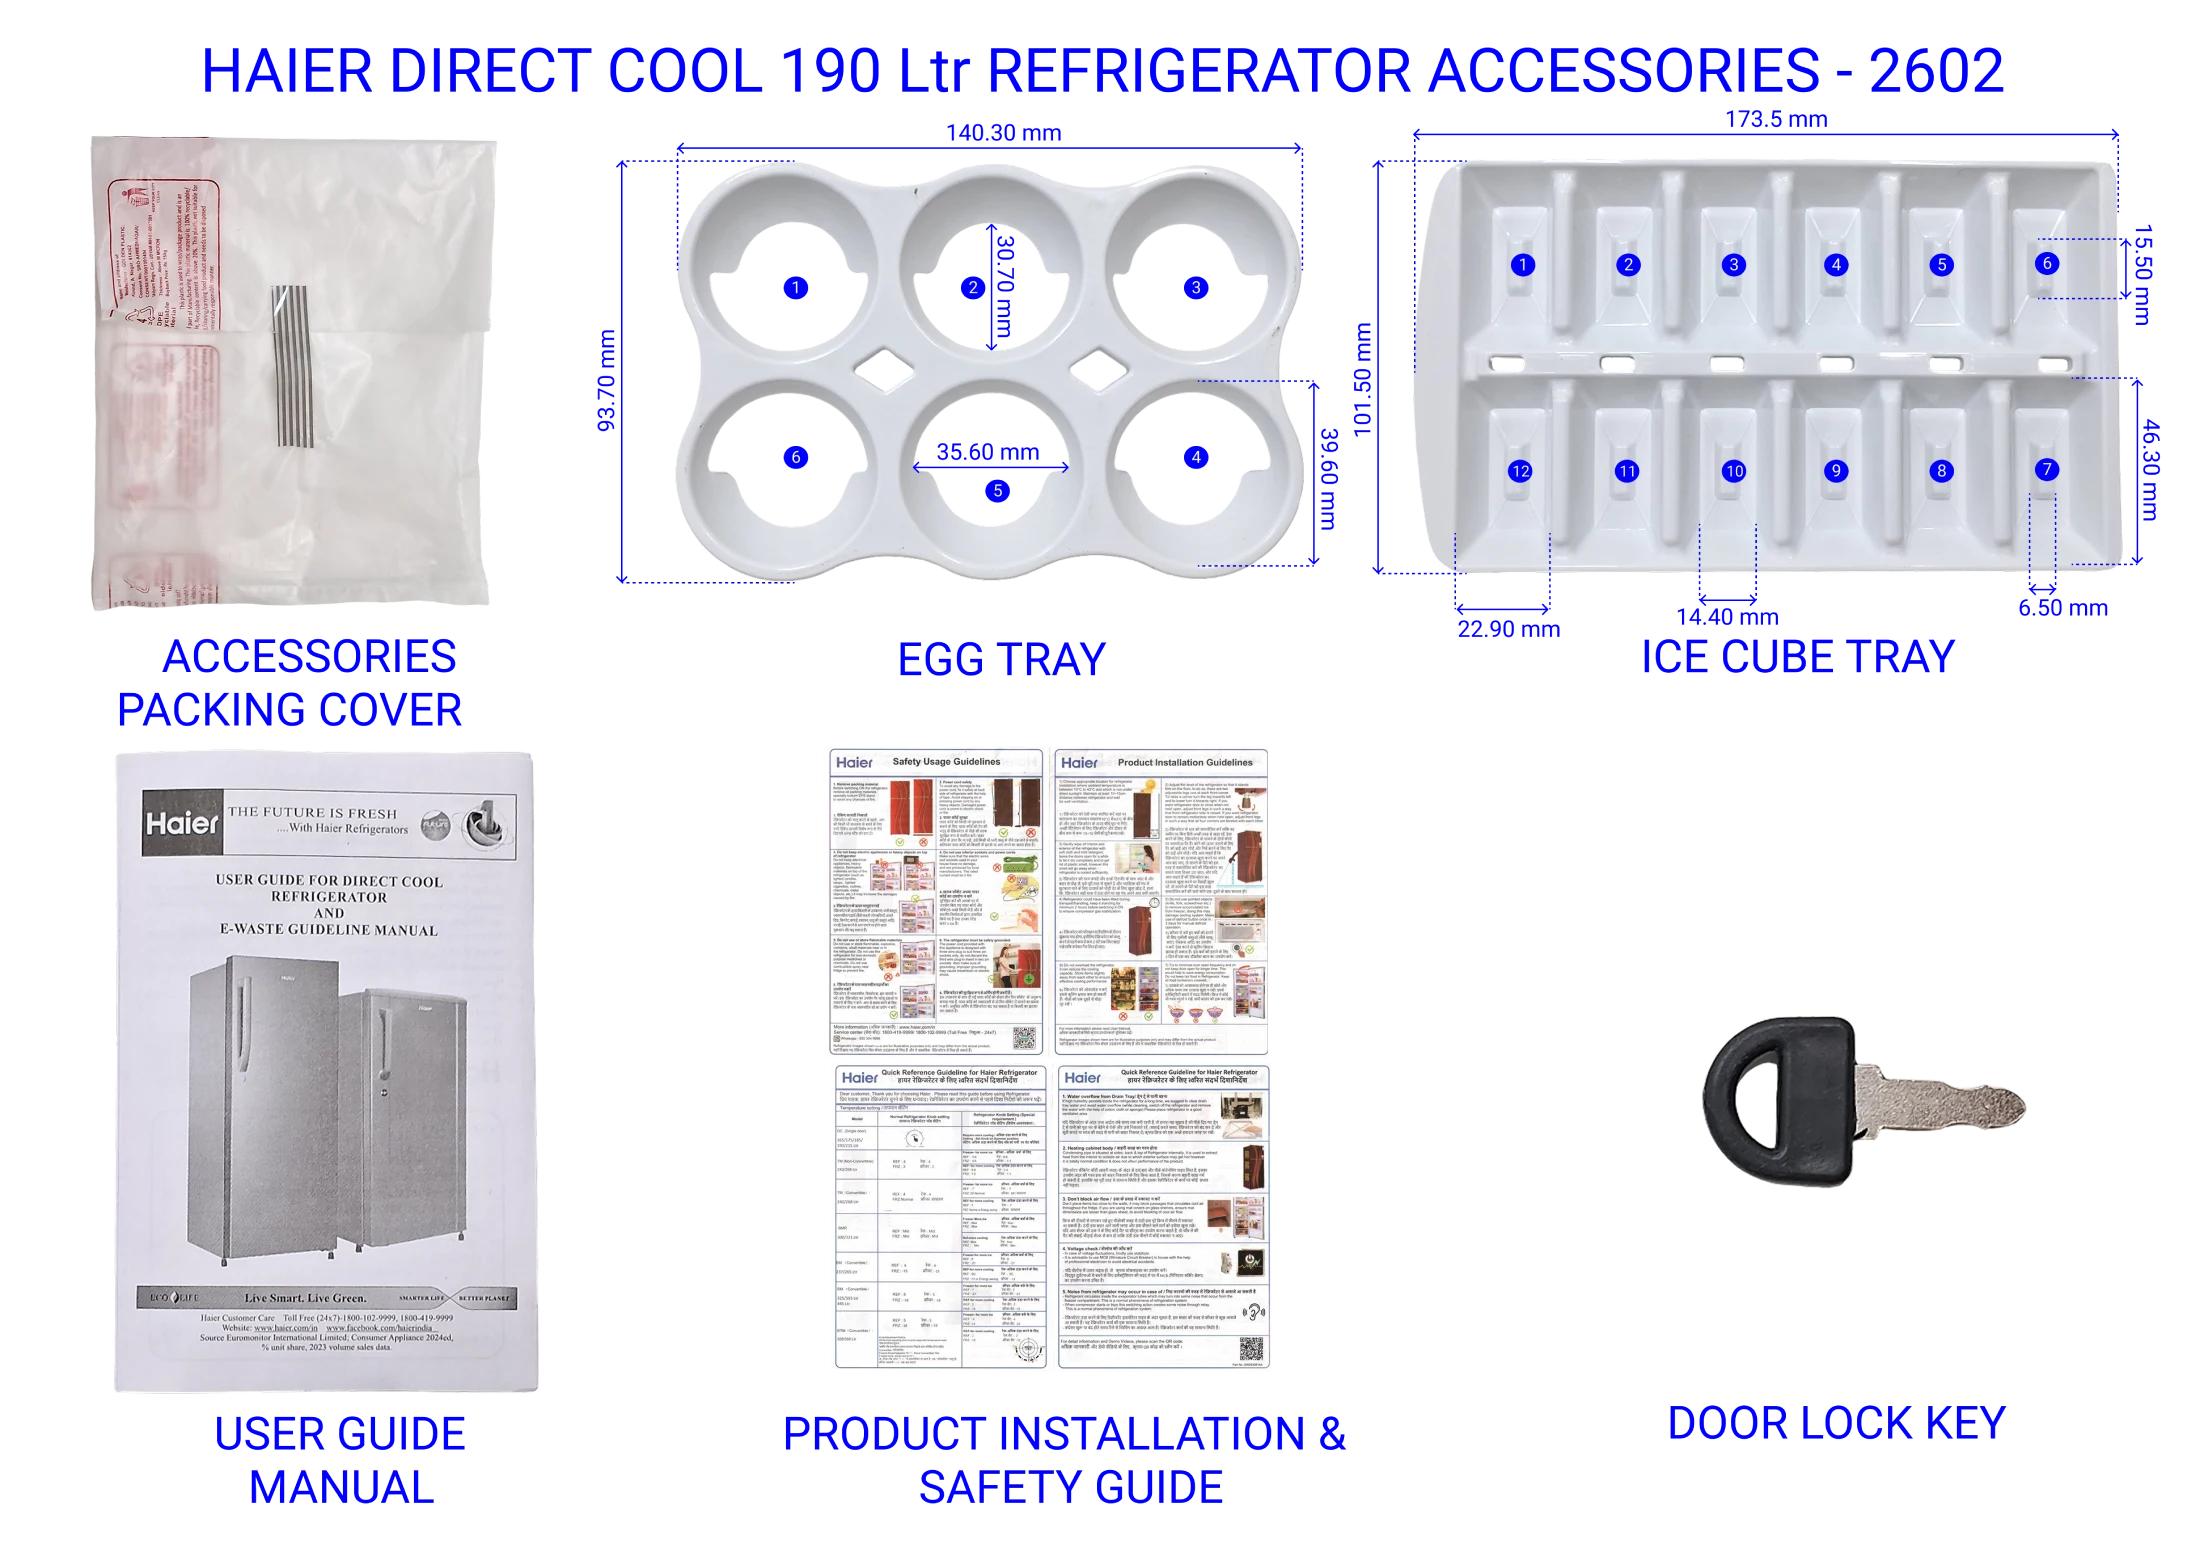
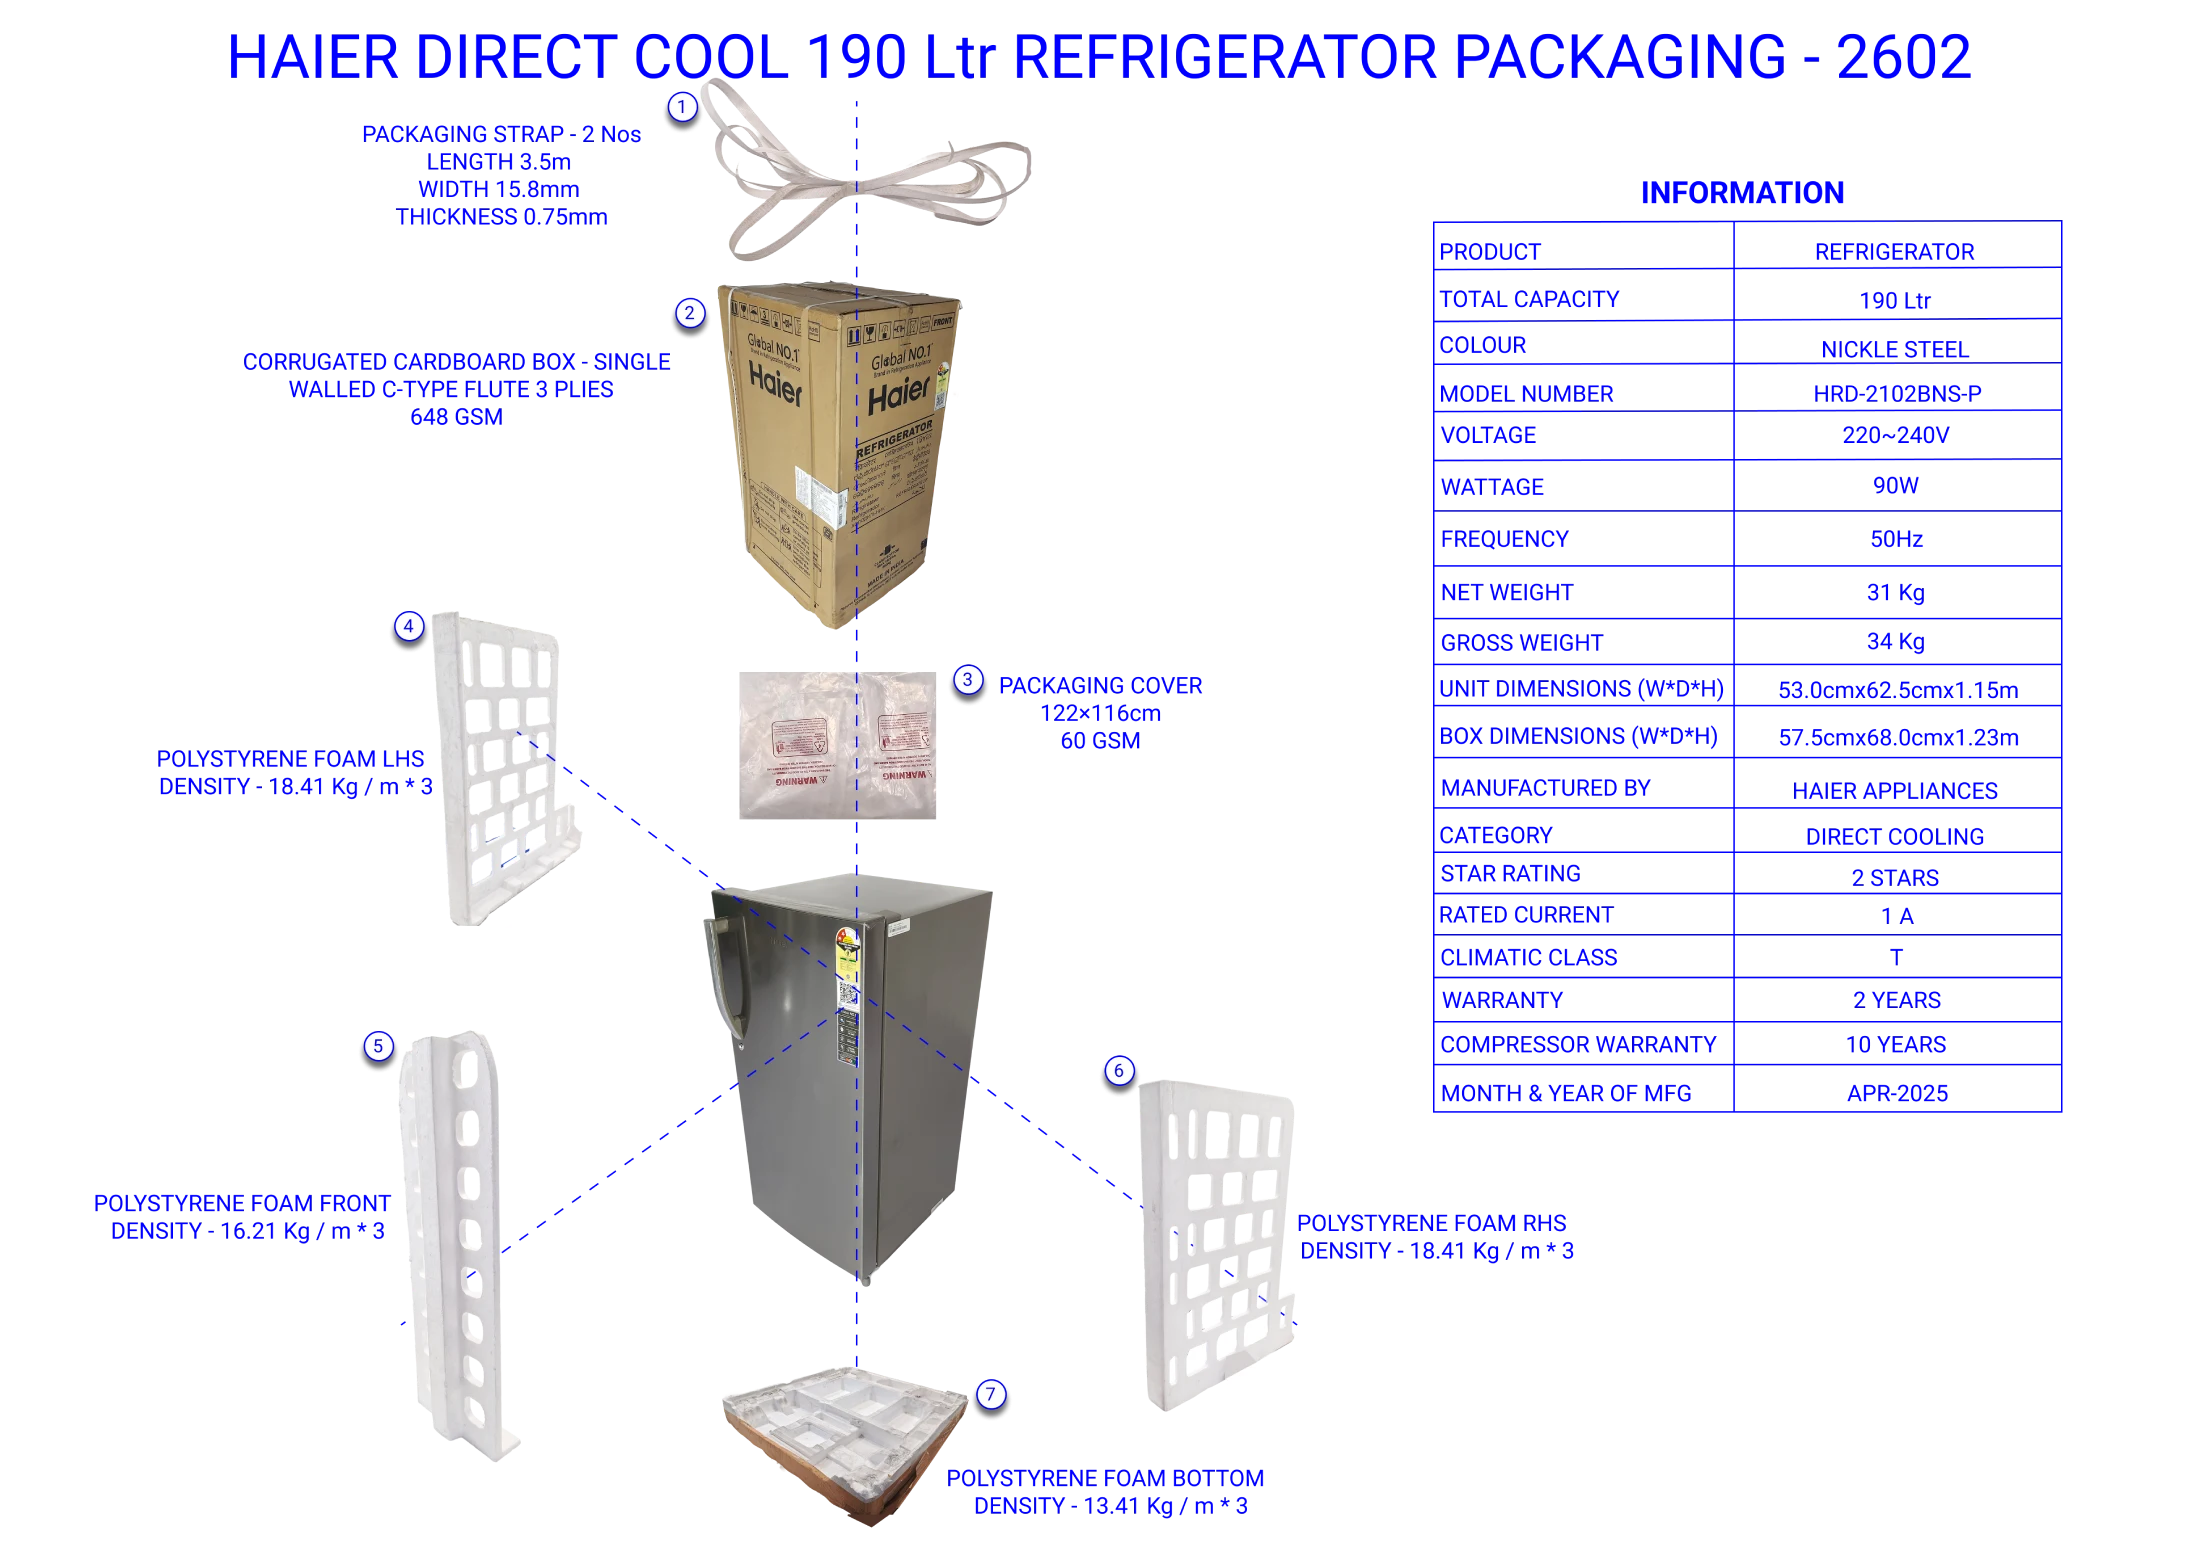
The refrigerator assembly contributes 90.3% of total weight, confirming that most material cost is concentrated in the core cabinet, liner, doors, and internal hardware. Packaging alone accounts for 9.5% of the total weight (3.18 kg), which is non-functional mass used purely for protection and logistics - highlighting a potential area for optimization. Accessories are negligible at 0.2%, indicating minimal impact on both cost and weight.
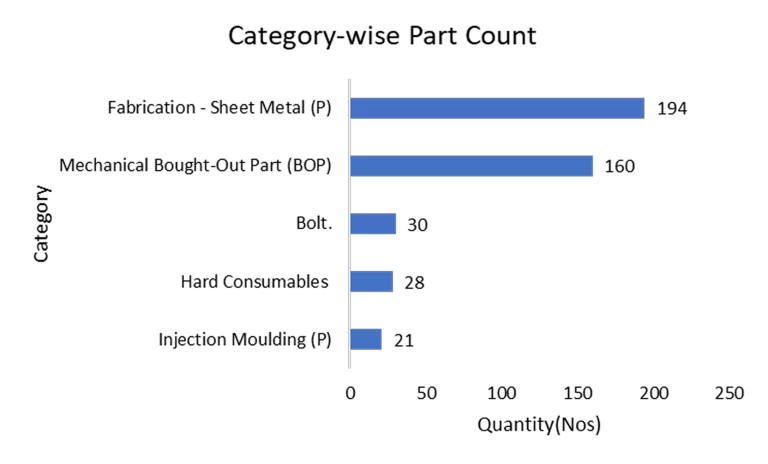
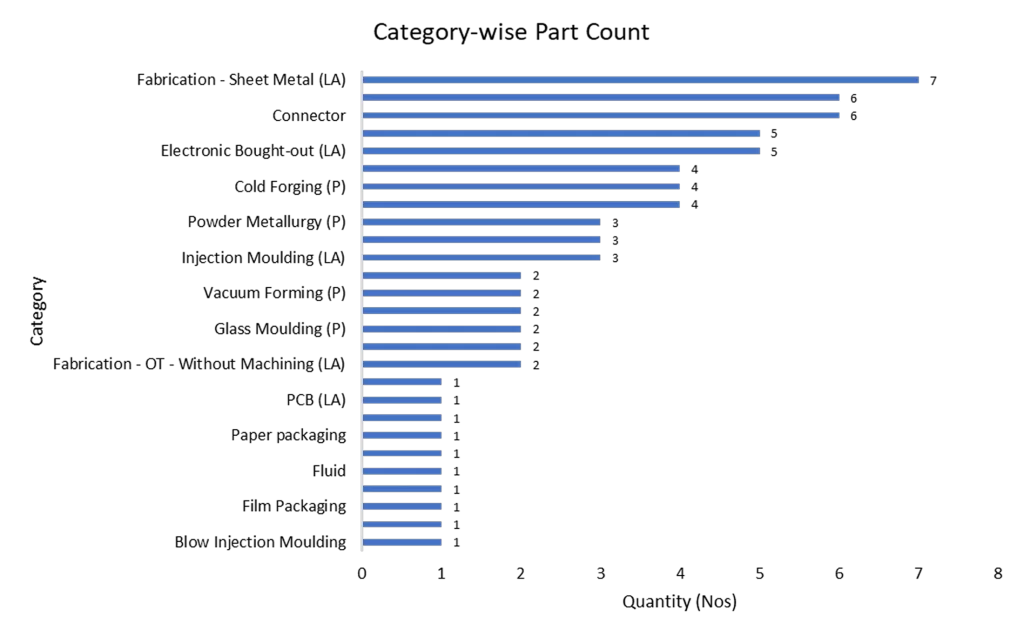
Part Count Distribution
The BOM contains nearly 500 individual parts, showing high assembly complexity. Fabrication --- Sheet Metal (P) and Mechanical BOPs dominate the part count with 193 and 160 parts respectively, forming the structural backbone and functional mechanisms of the refrigerator. All other categories like injection moulding, wiring harnesses, connectors, and packaging occur in small counts.
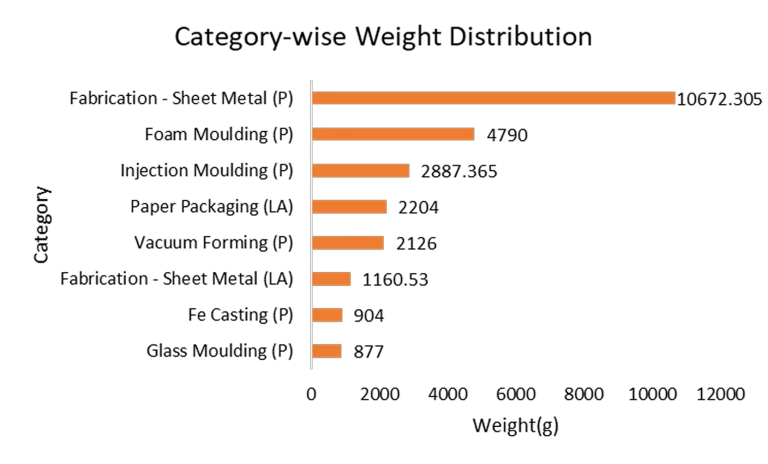
Weight Distribution by Manufacturing Category
- Fabrication --- Sheet Metal (P): 10,672.31g (47.4%) --- single largest contributor
- Foam Moulding (P): 4,790g (21.3%) --- significant insulation weight
- Injection Moulding (P): 2,887.37g (12.8%) --- plastic housing and structural parts
- Paper Packaging (LA) + Vacuum Forming (P): 4,330g (19.2%) --- substantial non-functional weight
- Fabrication --- Sheet Metal (LA): 1,160.53g (5.2%)
- Fe Casting (P): 904g (4%) | Glass Moulding (P): 877g (3.9%)
04Should Cost Analysis
A detailed should cost analysis approach was used to estimate the manufacturing cost. Key assumptions:
- The refrigerator is manufactured in India
- Annual production volume of 40,000 units was considered
- Material and labor cost benchmarks for Q1 FY25---26 were used
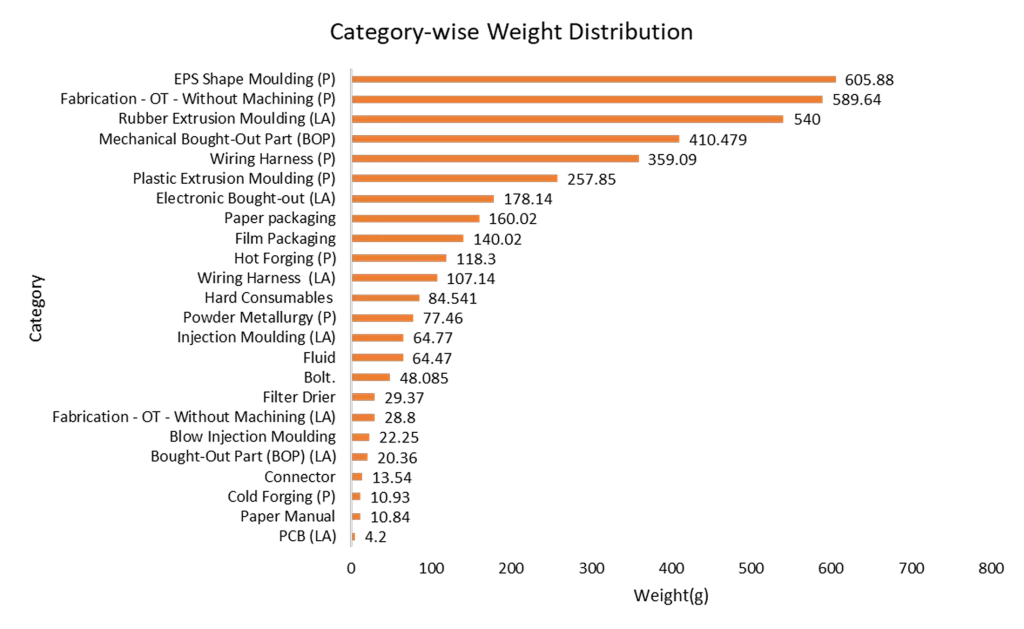
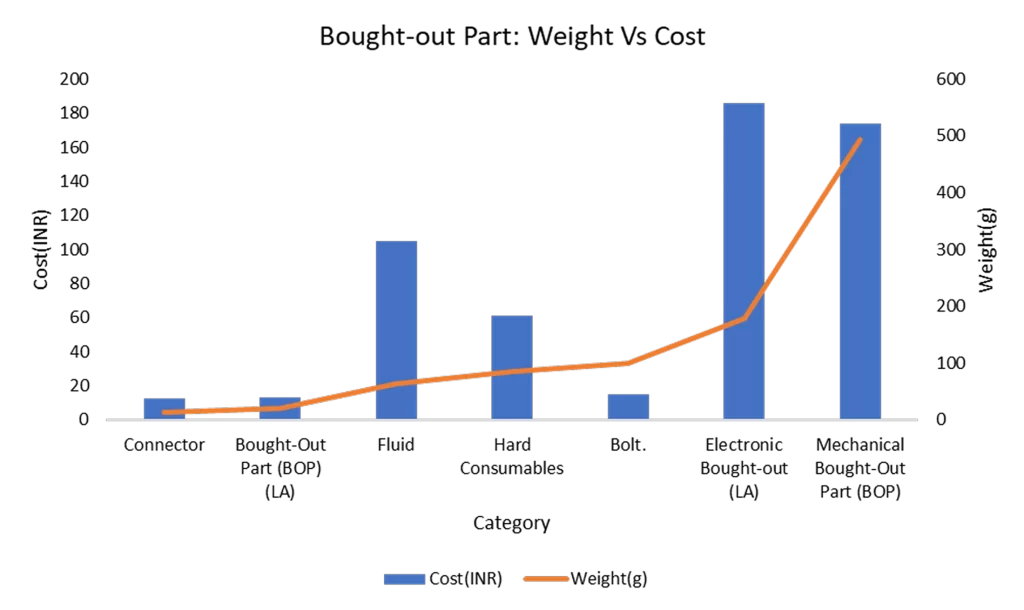
Bought-Out Parts Analysis
Bought-out parts are light in weight but cost-sensitive. Electronics (PCB and controls), mechanical BOPs, and refrigerant fluid are the primary cost drivers. Smaller items like connectors, bolts, and consumables contribute negligible weight and cost. This mismatch between low mass and high cost underscores the need for careful sourcing and supplier management in bought-out categories.
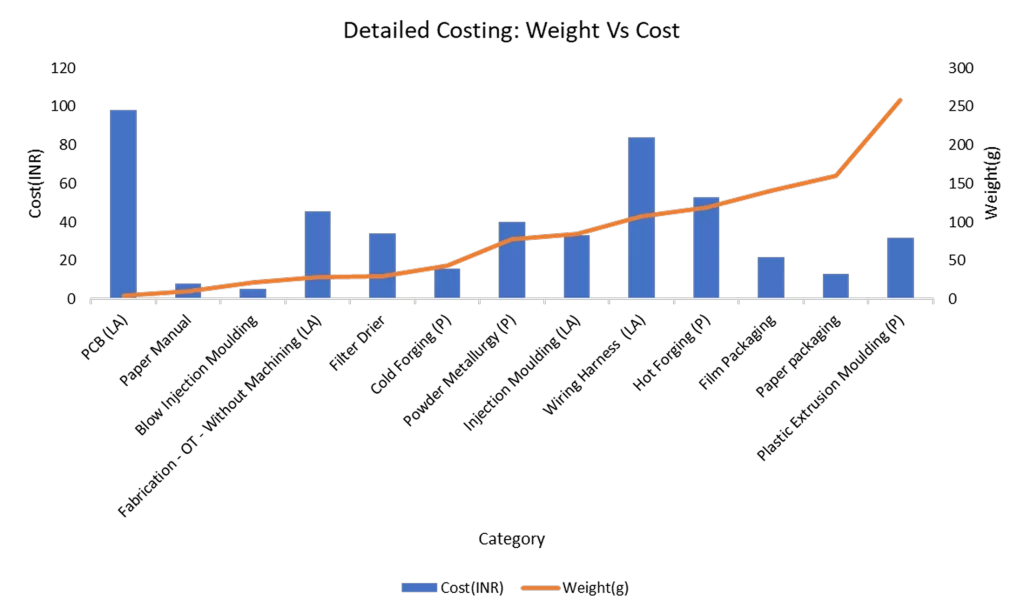
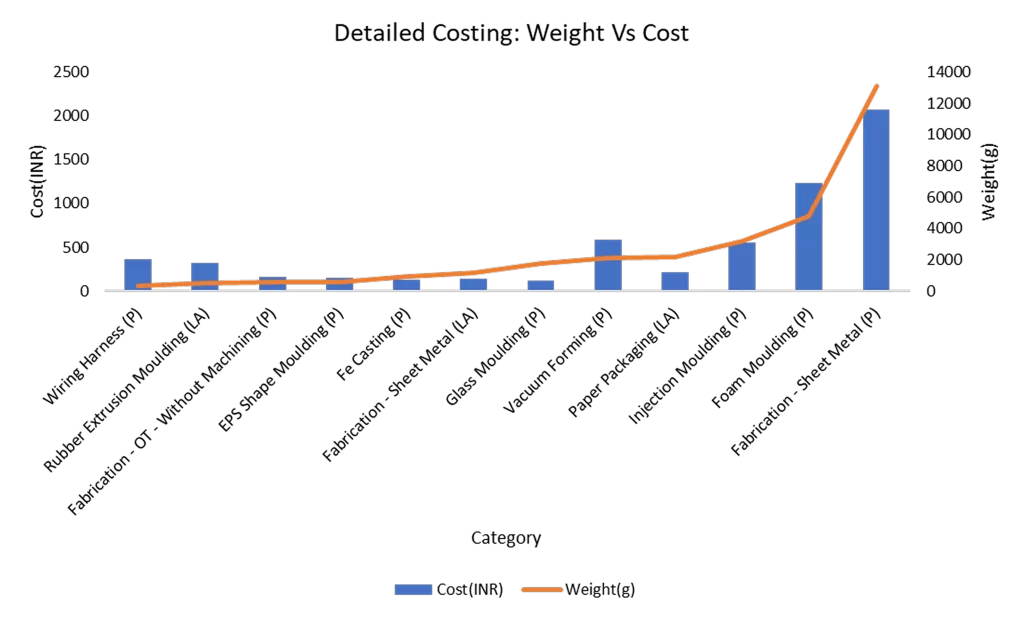
Detailed Should Cost Analysis
Fabrication --- sheet metal and foam moulding dominate both weight and cost. At the same time, wiring harnesses, rubber parts, and PCB show high cost despite low weight.
Insights Gained from the Teardown
Bought-out parts such as electronic controls and refrigerant fluid add critical functionality while accounting for a notable share of cost.
Should-Cost Summary
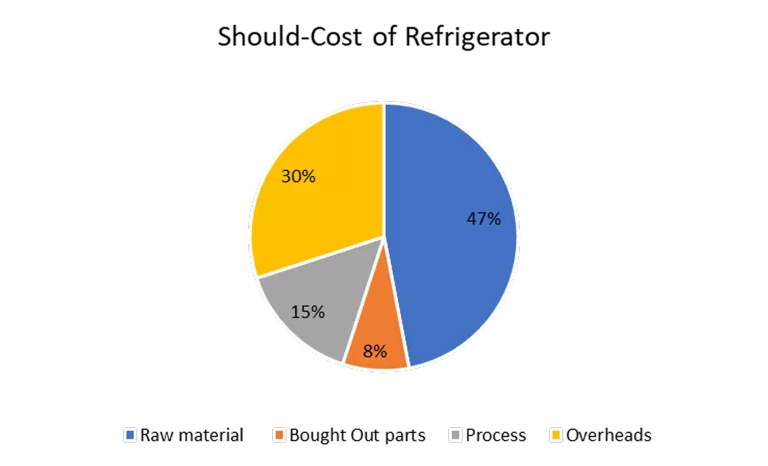
The should cost analysis study for the Refrigerator considers production scale, process requirements, and prevailing material and labor benchmarks. The cost structure is distributed as follows:
- Raw Materials: ?4,760.20 (47%) --- Primary contributor, driven by metals, plastics, and insulation foams
- Bought-Out Parts: ?854.90 (8%) --- Electronics, refrigerant fluid, and mechanical assemblies
- Processes: ?1,505.00 (15%) --- Fabrication-sheet metal, moulding, and assembly operations
- Overheads: ?3,102.10 (30%) --- Indirect manufacturing costs, logistics, and facility expenses
Total Estimated Should-Cost: ?10,222.20 per unit (India, 40k units/year)
This breakdown highlights a material-intensive cost structure, with raw materials and overheads together accounting for more than three-fourths of the total manufacturing cost.
Key Insights:
- Fabrication --- Sheet Metal (P) and Foam Moulding (P) together account for nearly 69% of total weight and a large share of cost
- Rubber seals, wiring harnesses, and PCBs are lightweight yet carry disproportionately high costs
- Packaging materials contribute nearly 9.5% of total weight but relatively little to cost
- The compressor, cost analysis ?2,077.15, is the most expensive component - the single largest cost driver
- High part count (~500) increases assembly complexity, driving handling, tooling, and process overheads
Summary Table: BOM and Should-Cost Overview
Summary: Production Volume: 40,000 units/year (India) | Total Weight: ~33.42 kg | Should-Cost: ?10,222.20 per unit | Major Cost Drivers: Compressor (?2,077.15), cabinet foam, and door panel
Conclusion: Refrigerator Cost Drivers & Sourcing Insights
This refrigerator teardown highlights the balance between heavy structural processes and lightweight but high-value components. Through BOM analysis and should-cost benchmarking, manufacturers can identify material-intensive categories, optimize sourcing of bought-out parts, and explore opportunities in packaging and assembly simplification.
Software Platforms Used
Should Cost Software
xcPEP delivers real-world accurate, transparent and defensible should cost analysis of mechanical, electrical and electronics components from drawings or physical parts.
Explore xcPEP →Should CostData
xcPROC is the centralized database engine powering xcPEP. Each database is meticulously curated by a dedicated data research team to be region-specific and time-specific.
Explore xcPROC →