55HP Agricultural Tractor Should Cost Analysis & Benchmarking
Deep dive teardown and should-cost analysis of a popular 55 HP diesel-powered agricultural tractor. Estimated manufacturing cost: INR 5,62,126. Comprehensive subsystem-level cost optimization insights.
Complete teardown and should cost analysis analysis of a popular 55 HP diesel-powered agricultural tractor. We mapped all part attributes, materials, and manufacturing processes to evaluate cost across 10 functional subsystems.
To provide actionable insights for tractor cost optimization, value engineering, and strategic sourcing through meticulous tractor parts benchmarking. The study estimates the BOM and uncovers precise cost distribution across key tractor subsystems.
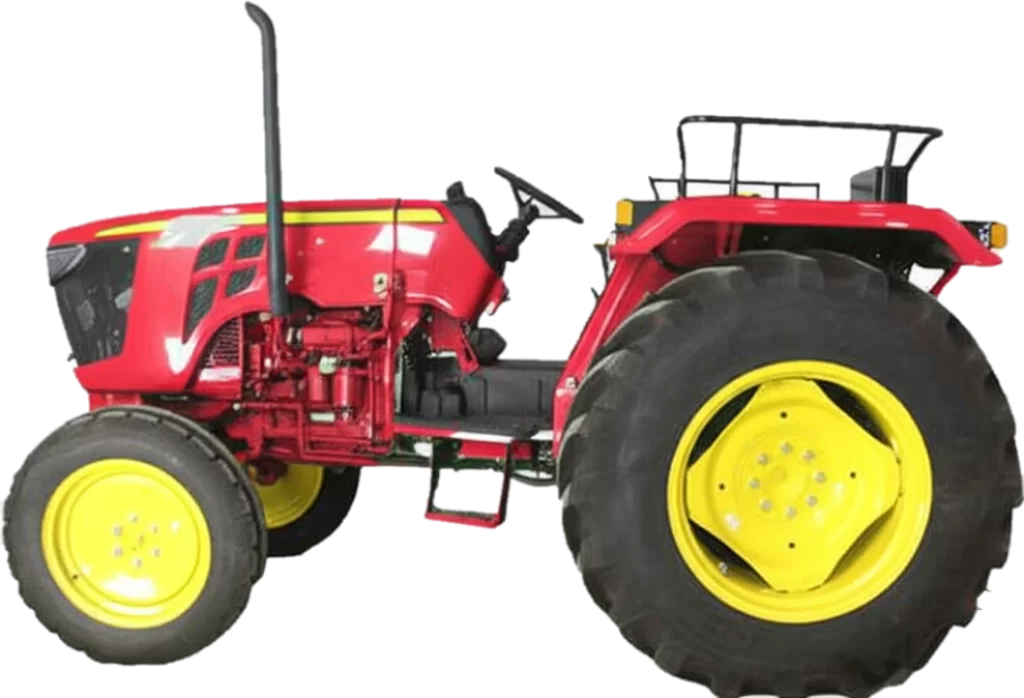
55 HP, 3-cylinder turbo-charged diesel tractor. 12 Forward + 4 Reverse gears, dual dry clutch, oil-immersed brakes, power steering, 2WD. Price segment: ₹11.15 to ₹12.84 lakh.
Subsystem architecture and teardown. BOM breakdown and weight distribution. Manufacturing category analysis. Material-wise weight distribution. Complete should-cost analysis with cost drivers. Key insights for cost reduction.
01Introduction & Specifications
Introduction: Navigating High Tractor Costs with Should Cost Analysis and Benchmarking
The agricultural machinery sector in India continues to evolve rapidly, with rising demand for mid-range tractors that balance power, efficiency, and affordability. For both farmers aiming to reduce tractor ownership costs and manufacturers striving for competitive pricing, understanding the true cost of components is paramount.
This in-depth analysis presents a complete teardown and should cost analysis analysis of a popular 55 HP diesel-powered agricultural tractor. We delve into this widely popular segment to estimate the Bill of Materials (BOM) and uncover the precise cost distribution across key tractor subsystems. Our goal is to provide actionable insights for tractor cost optimization, value engineering, and strategic sourcing through meticulous tractor parts benchmarking.
55HP Tractor Specifications: A Foundation for Cost Analysis
Understanding the specifications provides the context for our cost estimations. This 55 HP tractor, a common choice for small-to-medium landholding farmers, forms the basis of our tractor part should cost assessment.
| Parameter | Details |
|---|---|
| Engine Type | Turbo-charged 3 Cylinder Direct Injection |
| Engine Power | 55 HP (41.2 kW) |
| Fuel Type | Diesel |
| Fuel Capacity | 68 Liters |
| Rated RPM | 2100 RPM |
| Clutch Type | Dual Dry Clutch |
| Gearbox Configuration | 12 Forward + 4 Reverse |
| Brake Type | Oil immersed, Self-Adjusting, Self-Equalizing |
| Hydraulic Lift Capacity | 2000 kg |
| Steering Type | Power Steering |
| Maximum Forward Speed | 31.9 kmph |
| Maximum Reverse Speed | 24.5 kmph |
| Maximum Creeper Speed | 0.87 kmph |
| Emission Norms | BS-V / Stage V |
| Gearbox Type | Full Constant Mesh / Synchromesh |
| PTO Power | ~46–47 HP |
| Rear Axle Type | Direct Drive |
| Tyres | Front: 6.5x20, Rear: 16.9x28 |
| Drive Mode | 2WD |
| Price Segment | ₹11.15 to ₹12.84 lakh |
02Tractor Subsystem Architecture: Deconstructing for Cost Insights
The tractor was meticulously disassembled into 10 functional subsystems. This process allowed us to better understand the internal layout, assembly complexity, and component-level interdependence, all critical factors for accurate should cost analysis and benchmarking farm equipment. These include: Engine, After-Treatment System (ATS), Transmission & Driveline, Front Axle, Hydraulic System, Cab Operator Station, Electrical & Electronic Control Unit (ECU), Tyres & Wheels, and Tools & Accessories.
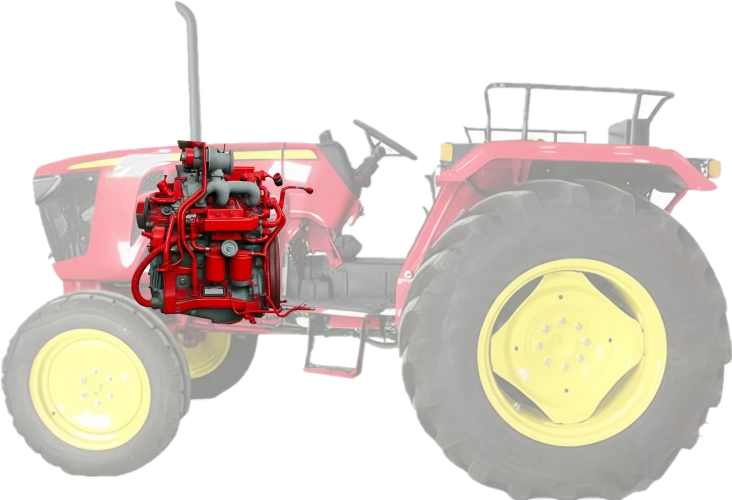
Engine Subsystem: Core of Tractor Performance and Cost
At the heart of the tractor lies a 3-cylinder diesel engine, optimized for rural field conditions. The cast-iron engine block, designed for high torque and long operational hours, contributes significantly to tractor manufacturing cost. The teardown revealed a direct-injection system. Supporting components include an air intake manifold, turbocharger, and a wet cylinder liner setup, all analyzed for their individual tractor engine parts cost.
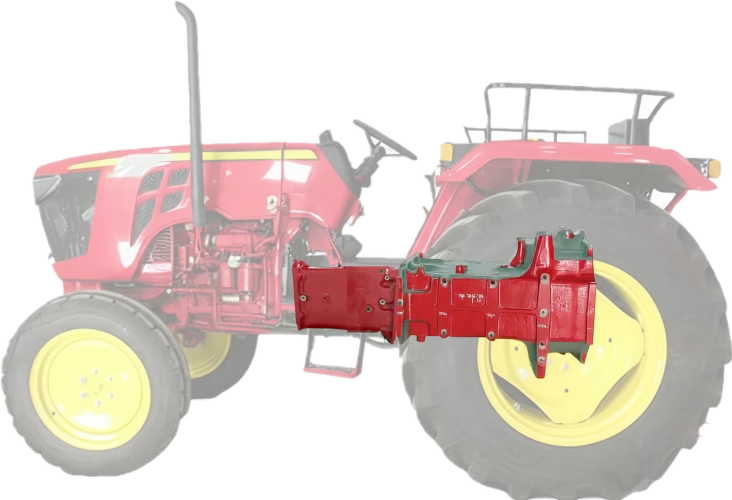
Transmission & Driveline: Key to Power Transfer and High Costs
The transmission system, featuring a full constant mesh or synchromesh setup with 12 forward and 4 reverse gears, is a major tractor cost driver. The teardown revealed forged steel gear clusters, oil-lubricated shafts, and a robust differential. The rear axle connects to the PTO output and is built for high torque transfer, making its cost analysis vital for tractor cost reduction.
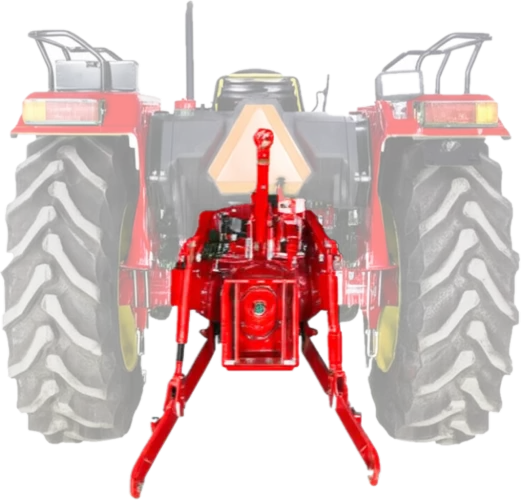
Hydraulic System: Essential for Implements and Cost Efficiency
One of the most vital systems in a tractor, the hydraulic system is responsible for operating implements like rotavators, ploughs, and cultivators. The teardown exposed a gear-type hydraulic pump connected to the PTO, a draft control valve, and lift arms with a mechanical sensing mechanism. Understanding the hydraulic system cost is key to cost-effective tractor parts sourcing.
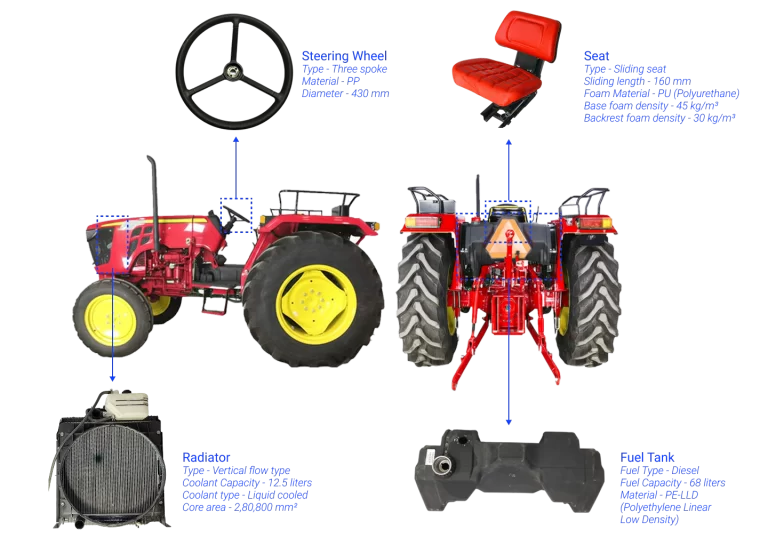
Cab Operator Station: Ergonomics vs. Cost Implications
Although tractors in this segment are not cabin-equipped like their higher-end counterparts, the operator station is ergonomically designed for long working hours. The seat is suspension-mounted with adjustable back support. The steering column includes a console with analog or semi-digital instrumentation for RPM, fuel level, and PTO engagement status. Analyzing the operator station cost helps in identifying areas for tractor comfort feature cost optimization.
Electrical & ECU: The Growing Role in Tractor Cost
The tractor is equipped with a 12V electrical system that powers the lights, instruments, and starter motor. The teardown revealed a basic wiring harness, a 65–80Ah battery, alternator, and fuses. For BS-V emission compliance, an ECU is used to manage fuel injection and diagnostic protocols. The electrical system cost is a growing segment in tractor part should costs.
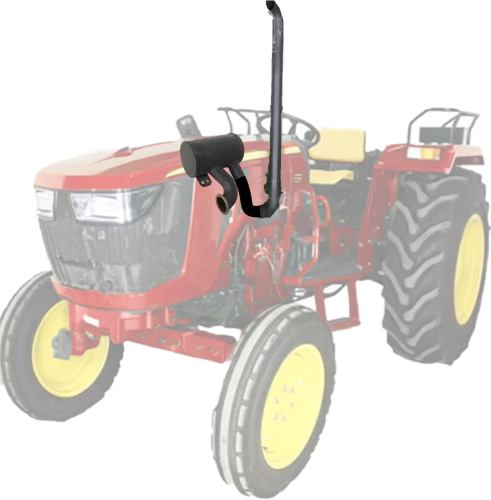
After-Treatment System (ATS): Regulatory Compliance and Cost
The BS-V emission regulations necessitate an after-treatment system, which in this tractor includes a Diesel Oxidation Catalyst (DOC) and Diesel Particulate Filter (DPF). Temperature and NOx sensors are mounted both upstream and downstream of the system for real-time emission monitoring. While low in weight, the ATS cost is critical for regulatory compliance in tractor manufacturing.
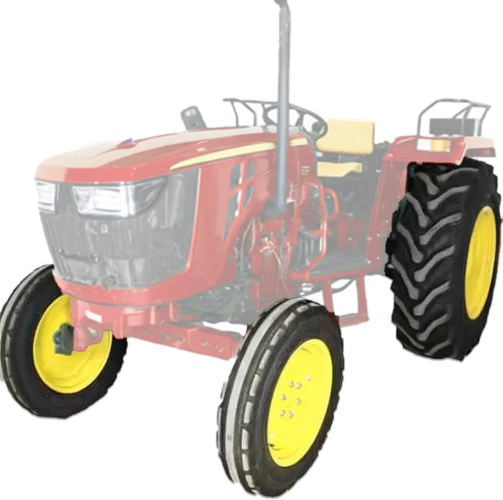
Tyres & Wheels: Significant Contributor to BOM Cost
The front tyres are 6.5 x 20 and the rear tyres are 16.9 x 28 - standard for 2WD tractors in this segment. These are supplied by local manufacturers such as CEAT, JK Tyre, and MRF. Tyres contribute approximately 12–15% to the total BOM cost and are fully localized. This highlights the importance of benchmarking tractor tire prices for overall tractor cost reduction.
Visual Breakdown of Key Comfort and Utility Components
03BOM & Weight Analysis
Tractor Bill of Material (BOM) Breakdown: Granular View of Tractor Costs
We conducted a detailed teardown of a 55 HP tractor to gain a deep understanding of its subsystem architecture, internal assemblies, and part composition. This teardown study focused on identifying and analyzing various component attributes, enabling a granular view of the machine's design, material usage, and mechanical integration.
Following the tractor teardown, we developed a Multi-level BOM (Bill of Materials) structure that maps the entire tractor, from major subsystems such as powertrain and chassis to finer elements like fasteners and electricals. This structured BOM offers valuable insights into the tractor's construction, manufacturing strategy, and cost distribution across different assemblies, crucial for benchmarking tractor parts effectively.
Subsystem-Wise Weight Contribution – Pareto Analysis: Identifying Weight-Cost Relationships
To better understand which manufacturing categories contribute the most to the overall weight of the 55 HP tractor, a Pareto analysis was conducted. This analysis helps identify areas for lightweighting and material substitution which directly impact tractor manufacturing costs.
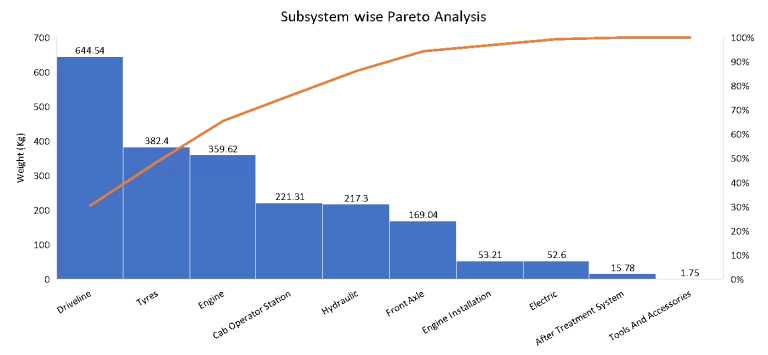
Key Observations
The top three subsystems - Driveline, Tyres, and Engine - contribute over 70% of the total tractor weight. Driveline alone contributes nearly 35–40%, making it the single largest contributor. Secondary contributors include: Cab/Operator Station, Hydraulic System, Front Axle. Remaining subsystems such as Engine Installation, Electrical, After-Treatment System, Tools and Accessories account for less than 10% of the weight.
Manufacturing Category-Wise Weight Distribution Analysis
A granular view of the weight distribution across manufacturing categories provides deep insights into the material and process choices made during the development of a 55 HP tractor. This breakdown highlights the contribution of cast, forged, and fabricated components and helps in identifying opportunities for lightweighting, material substitution, and significant tractor cost optimization.
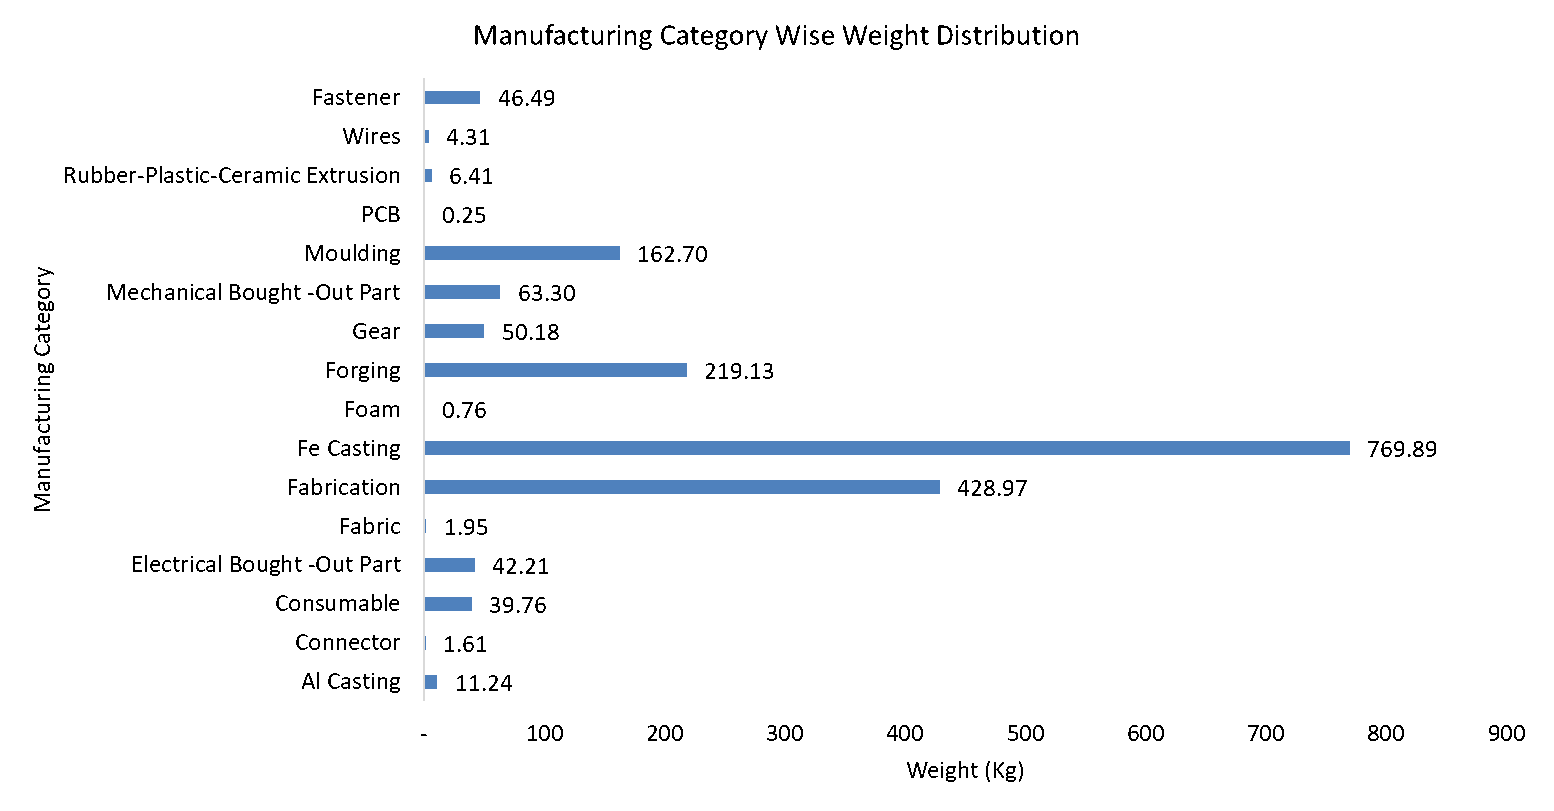
Key Highlights from the Weight Distribution
Fe Casting (Ferrous Casting) is the heaviest contributor, making up 769.8 kg. Fabrication parts weigh 428.9 kg. Forging accounts for 219.1 kg. Moulding parts weigh 162.7 kg. Mechanical Bought-Out Parts contribute 63.3 kg. Gears alone weigh 50.1 kg. Fasteners (46.4 kg), and Electrical Bought-Out Parts (42.2 kg) each represent a significant share. Lightweight categories include Aluminium Casting (11.2 kg), Connectors (1.6 kg), Wires (4.3 kg), Fabric (1.9 kg), and PCB (253 g).
Manufacturing Category-Wise Count Analysis: Understanding Assembly Complexity
Analyzing part counts across manufacturing categories provides insight into the complexity of assembly, supply chain dependencies, and the design strategy of the 55 HP tractor.
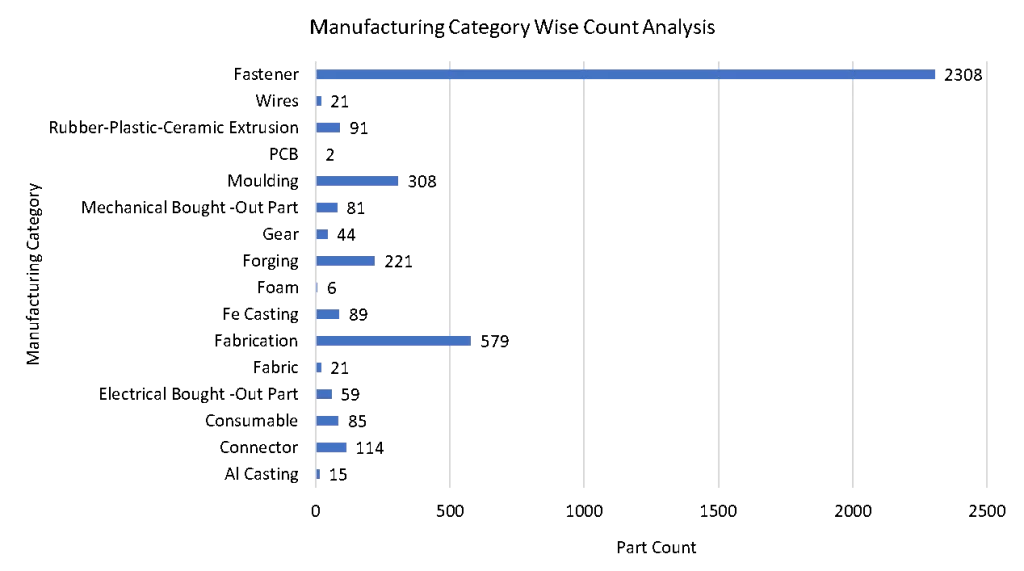
Key Highlights from the Count Analysis
Fasteners dominate the component count with 2,308 parts. Fabrication parts are next with 579 components. Moulding accounts for 308 parts. Forging contributes 221 components. Fe Casting parts total 89. Gear components are 44. Foam and PCBs have minimal counts (6 and 2 respectively).
Fe Casting parts total 89, showing fewer but typically heavy and critical structural components. Mechanical Bought-Out Parts (81) and Consumables (85) reflect vendor-supplied items like bearings, filters, and linkages. Electrical Bought-Out Parts count at 59, indicating a moderate presence of electrical sub-assemblies and control units. Gear components are 44, aligning with the tractor's transmission complexity. Aluminium Casting includes 15 components, used likely in lighter non-load bearing parts.
This count-based breakdown reveals the intricate balance between structural robustness and integration flexibility, offering insights into design trade-offs and cost drivers.
Material-Wise Weight Distribution Analysis
Understanding the material composition of the tractor offers valuable insights into design priorities such as durability, manufacturability, cost-efficiency, and weight optimization.
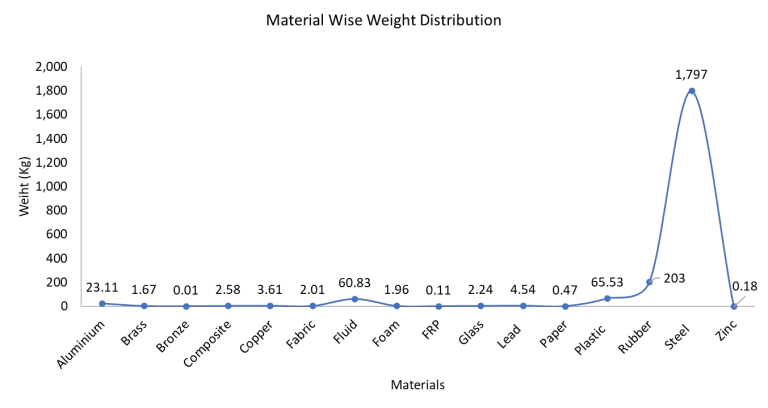
Key Observations from the Material Wise Weight Distribution
Steel is the dominant material, contributing 1,797 kg. Rubber is the second-largest contributor at 203 kg. Plastic materials weigh 65.53 kg. Fluid contributes 60.83 kg. Aluminium accounts for 23.11 kg. This analysis highlights that over 85% of the tractor's weight comes from just three materials - Steel, Rubber, and Plastic.
04Cost Analysis
Tractor Should-Cost Analysis: Estimating True Manufacturing Expenses
We conducted a comprehensive teardown of the 55 HP tractor, involving a detailed assessment of each subsystem and component. The goal was to map all part attributes and materials to evaluate manufacturing feasibility and derive an accurate cost estimation for the complete tractor assembly.
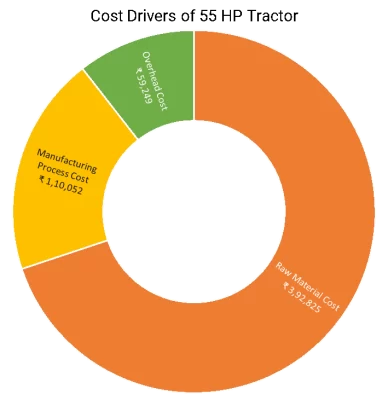
Should Cost Drivers of a 55 HP Tractor
A Multi-level Bill of Materials (BOM), along with in-depth subsystem analysis and Should Cost Analysis, was performed on the 55 HP tractor. Based on the teardown findings and part-level assessments, the estimated manufacturing cost of the tractor is INR 5,62,126. The following factors were considered in the study:
- The tractor was manufactured in India.
- The estimated production volume for the study was set at 10,000 units annually.
- The latest material rates and labor cost benchmarks were taken for Q1 FY25-26.
Subsystem-Wise Cost Analysis of a 55 HP Tractor: Prioritizing Cost Reduction Efforts
A detailed subsystem-level cost analysis was performed on a 55 HP tractor to understand the cost contribution of each major assembly.
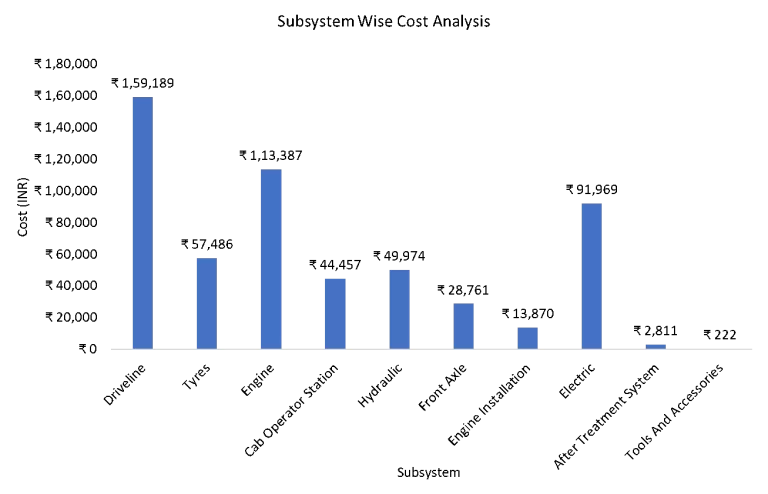
Key Observations
Driveline is the most expensive subsystem, cost analysis ₹1,59,189. Engine follows closely with a cost of ₹1,13,387. Electrical system contributes significantly at ₹91,969. Other moderate contributors include Tyres (₹57,486), Hydraulic system (₹49,974), and Cab Operator Station (₹44,457). Front Axle (₹28,761) and Engine Installation (₹13,870) show relatively lower costs. After-Treatment System (₹2,811) and Tools & Accessories (₹222) are the least cost-intensive components.
Manufacturing Category-Wise Cost Analysis: Targeting High-Impact Processes
A detailed cost assessment was carried out by mapping all components of the 55 HP tractor to their respective manufacturing categories.
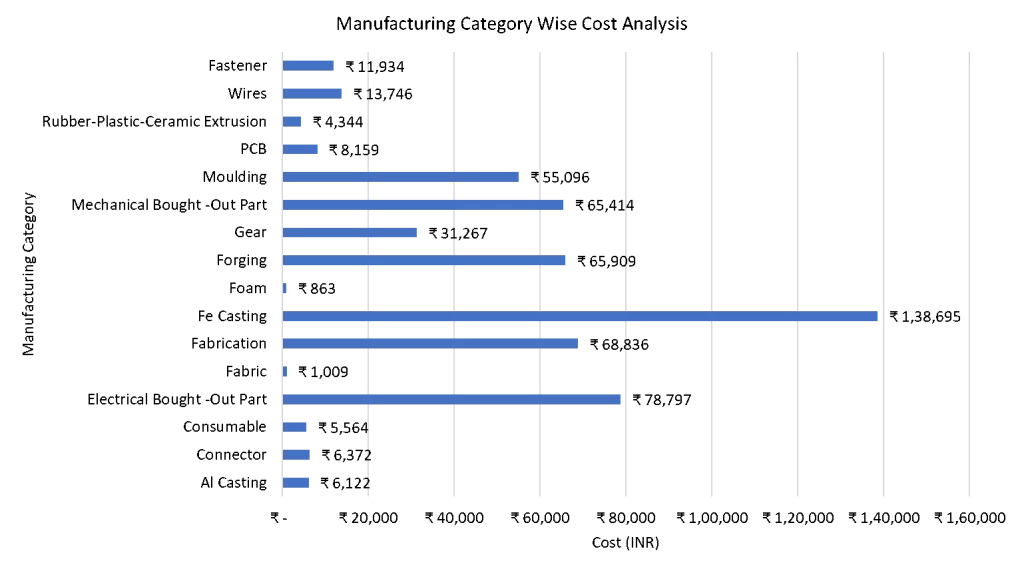
Key Insights
Fe Casting dominates the cost distribution with ₹1,38,695. Electrical Bought-Out Parts are the next major contributor at ₹78,797. Fabrication makes up ₹68,836. Forging and Mechanical Bought-Out Parts contribute ₹65,909 and ₹65,414 respectively. Moulding accounts for ₹55,096. Gear components add ₹31,267. Over 60% of the cost is concentrated in just Fe Casting, Electrical Parts, Fabrication, and Forging.
05Key Insights & Conclusion
Key Insights Gained from the Tractor Teardown
Driveline and Engine Dominate Costs: Together, these subsystems account for the highest share of weight and manufacturing cost, making them prime targets for cost optimization through tractor component redesign or alternative material sourcing.
Fe Castings Lead Material Usage: Heavy reliance on steel castings indicates a focus on structural strength and durability, but also presents opportunities for material cost reduction if lighter, equally robust alternatives are viable.
Electrical Systems Are Gaining Significance: Electrical components and ECUs are contributing more to cost due to regulatory and feature-driven requirements.
Hydraulics Define Implement Compatibility: The design and efficiency of the hydraulic system directly influence performance with various farm implements.
High Fastener Count Shows Modular Design: Over 2,000 fasteners reflect a highly serviceable, modular assembly approach, which can influence assembly time and labor costs.
Cabin Ergonomics Matter: Even without an enclosed cab, comfort features like suspension seats and intuitive controls are well-integrated.
Emission Compliance Adds Complexity: BS-V norms necessitate after-treatment systems that, while low in weight, are critical to compliance and add a non-negotiable regulatory cost to tractors.
Conclusion: Your Path to Lower Tractor Costs
The meticulous teardown and should-cost analysis of the 55 HP tractor highlights key cost and weight drivers - primarily the driveline, engine, and electrical systems. Steel remains the dominant material, supported by significant use of forgings, castings, and fabricated parts.
This study offers actionable insights for tractor cost optimization through design refinement, strategic material choices, and efficient sourcing strategies. By systematically benchmarking tractor parts and applying robust should cost analysis methodologies, both agricultural equipment manufacturers and farmers can identify critical areas for significant cost reduction, streamline supply chains, and make informed design and purchasing decisions.
Software Platforms Used
Should Cost Software
xcPEP delivers real-world accurate, transparent & defensible should cost analysis of mechanical, electrical & electronics components from drawings or physical parts.
Explore xcPEP →Should CostData
xcPROC is the centralized database engine powering xcPEP. Built entirely by ASI's data research team, each database is meticulously curated to be region-specific and time-specific.
Explore xcPROC →