Automotive Cost Reduction Studies
Reduce manufacturing cost through competitor cost benchmarking, detailed cost reduction studies, and automotive should costing using xcPEP—our advanced should cost modelling software.
ASI Engineering delivers cost reduction by benchmarking your vehicle against a competitor’s—tearing both down, analyzing every cost driver, and identifying differences that lead to actionable savings ideas. Using xcPEP, our advanced should cost analysis tool, we simulate manufacturing logic step-by-step to uncover hidden cost-saving opportunities.
What makes our automotive should costing methodology stand apart is the use of ASI’s proprietary should cost data—a comprehensive cost database of machines, raw materials, labor rates, and more. We do not rely on third-party estimates. This ensures every should cost model is grounded in reality.
The result? A transparent, traceable, and highly accurate should cost value that explains how every figure is derived. This level of clarity helps your team move beyond surface-level cost assumptions to uncover deep, engineering-driven cost reduction opportunities.
Teardown benchmarking
Of Customer's & Competitor's Vehicles
Should Costing
Of Customer's & Competitor's Vehicles
Cost Reduction Idea Generation
By analyzing cost gaps between customer's and competitor's vehicles.

Challenges in Cost Reduction in Automotive Industry
Too many opinions, too little data
Inaccurate should-costing
When should costing is based on assumptions rather than real manufacturing logic, the output lacks credibility and often fails to hold up in supplier negotiations. To drive meaningful results, teams need accurate should cost modelling software that reflects actual production processes.
Scattered data across teams
Different teams often use separate Excel files or isolated tools for should costing, leading to duplication, inconsistency, and confusion. Without a unified should costing software used across the organization, it’s impossible to maintain a single, aligned view of cost drivers.
Limited process-level breakdown
Most teams rely on outdated or legacy should cost analysis software that doesn’t break down costs at the operation level. Without a clear view of how each manufacturing step contributes to the final cost, engineering teams struggle to identify true savings potential.
Poor idea tracking across projects
Manual tools like Excel don’t support ongoing tracking of savings ideas. A proper cost analysis platform ensures follow-through, collaboration, and long-term retention of cost reduction opportunities.
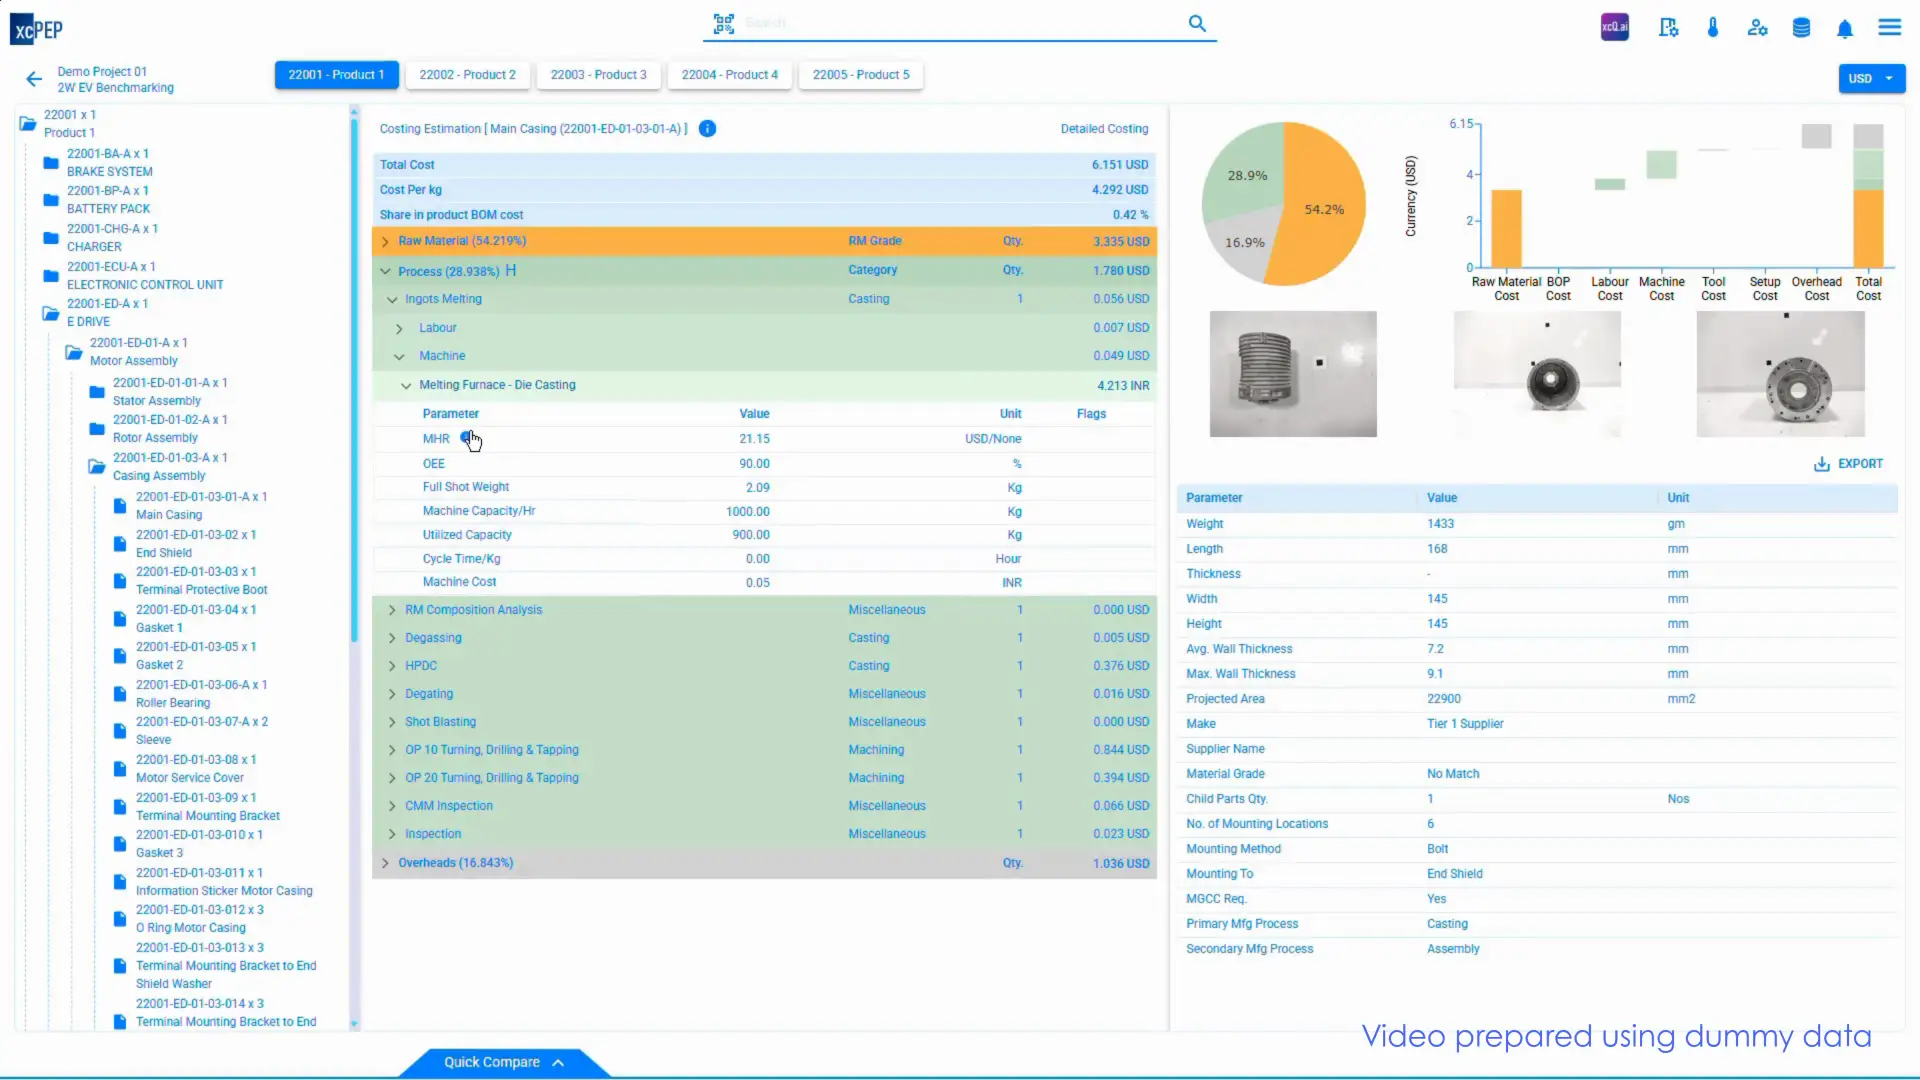
xcPEP Should Cost Tool
Turns Raw Teardown Data Into Repeatable Savings
xcPEP, our cloud native should costing software ingests the complete teardown of your vehicle and a direct competitor, aligns every geometry point, material grade, machine setting, labour input, and logistics factor, then calculates the cost gap part by part. Its analytics engine pinpoints where you overspend, identifies the technical or commercial driver, and ranks every saving by impact and ease of execution. Engineering and purchasing teams receive a clear action list with quantified benefit and implementation guidance, all inside one shared platform. Each study starts with a structured teardown of both vehicles, and xcPEP converts that raw benchmark data into a living model that keeps your targets ahead of the market.
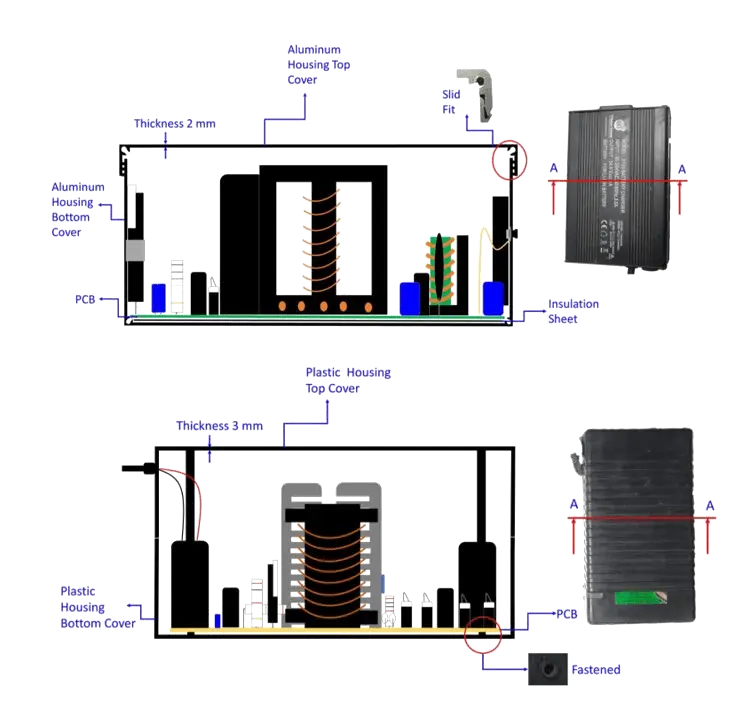
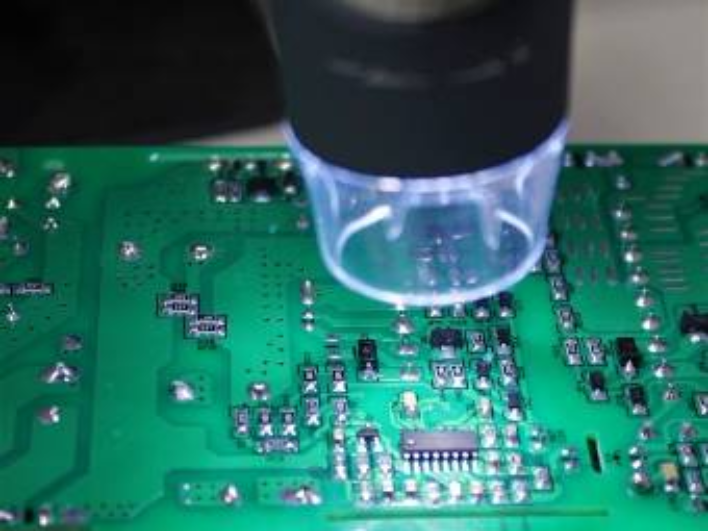
Superior Data Mapping in xcPEP
xcPEP, our should costing software brings structure, speed, and repeatability to cost reduction by automating the capture of geometry, material, and process-related inputs. ASI Engineering uses in-house systems to extract all key dimensions and features that affect manufacturing cost. PCB assemblies are scanned and classified using AI, physical parts are measured for bounding box dimensions and projected area—all without manual input. The captured data flows directly into xcPEP, where it is linked to the correct BOM line and mapped to process logic. This allows teams to compare each part against a benchmark with precision and identify where cost gaps are driven by design, material, or manufacturing choices.
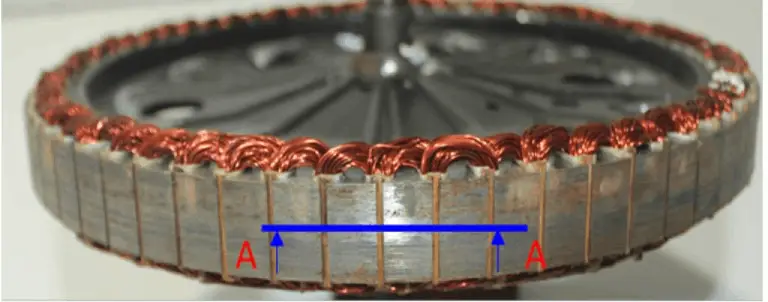
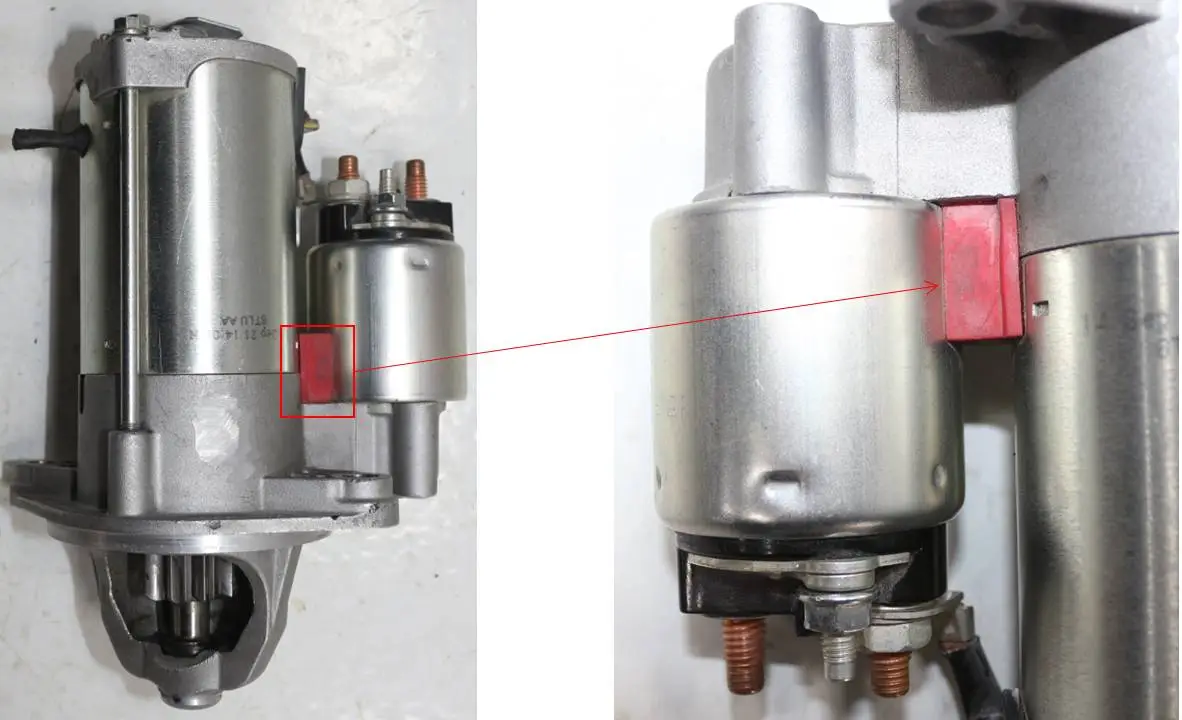
Part Measurement Data
ASI Engineering tears down your vehicle and the competitor vehicle side by side. Every part is scanned, measured, and digitally mapped using high-resolution tools. Wall thickness, feature depth, and projected area are captured for both sets of parts and pushed into xcPEP, our should costing software. This gives us a clean, structured view of how geometry choices impact cost. When a competitor uses less material or avoids secondary operations, xcPEP, our cost modelling software highlights that exact region—pinpointing how and where your design can be optimised to reduce cost.
Accurate Raw Material Identification
Material samples from both vehicles are lab tested by ASI Engineering using XRF, density checks, and chemical analysis. We do not rely on assumed grades or supplier claims. Every confirmed grade is linked to regional prices from xcPROC, our should cost database inside xcPEP. The material cost delta is no longer a guess. It becomes a clear, actionable gap. If the competitor achieves the same strength using a lower-cost alloy or polymer, xcPEP, our should cost software calculates exactly how much cost you can save by switching, backed by real-world should cost data.
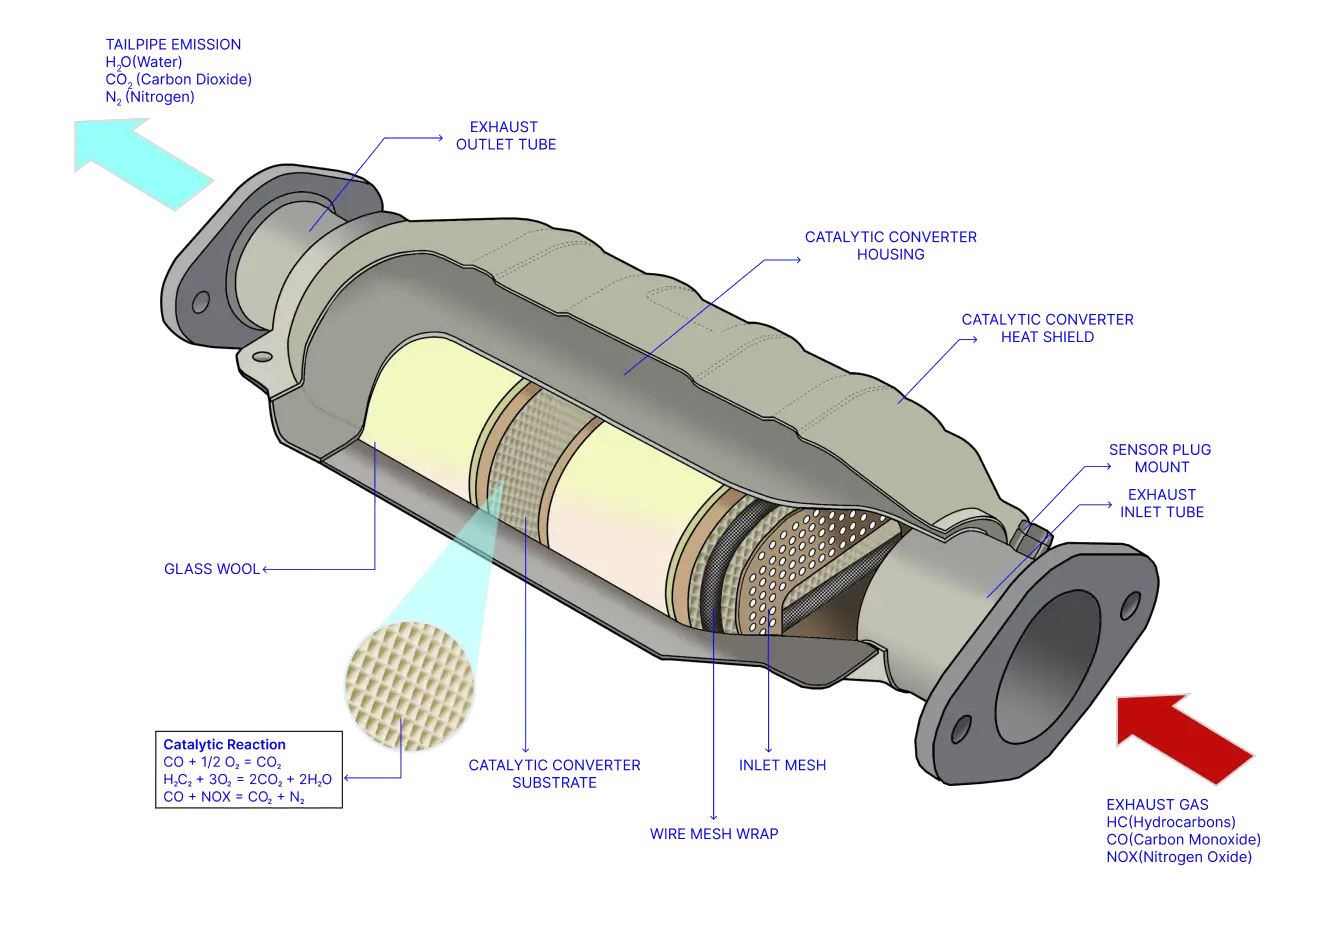
Detailed Manufacturing Process Calculation
For each part, ASI Engineering models the real manufacturing route including stamping, molding, welding, machining, and painting. We enter exact parameters into xcPEP such as tool life, scrap, OEE, and cycle time for both vehicles. Instead of generic estimates, we compare true process logic to uncover cost drivers. If the competitor builds the same part using fewer steps or a faster process, xcPEP shows you the exact value of making the same change.
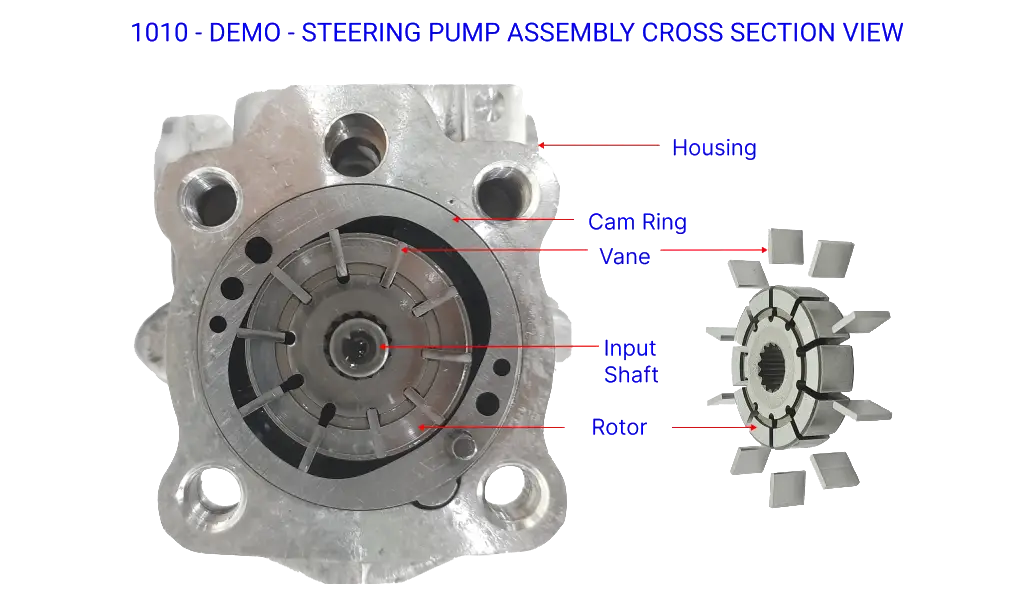
Machine Identification & MHR Calculation
Our team maps the actual machine class used for each operation including tonnage, power, and capability. xcPEP calculates machine hour cost from capital, energy, and maintenance. This lets us compare what machine the competitor would use versus yours. If the competitor part is built on a more efficient setup, we show the cost saving you can realise by making a similar shift.
Labour Skill Identification & LHR Calculation
ASI Engineering identifies the actual skill level and manpower needed for each process step. Using xcPROC regional wage data, xcPEP calculates the labour hour cost for both vehicles. Where the competitor uses fewer operators or a simpler join method, the savings are visible. This helps your team understand where labour complexity is adding cost and what process simplifications are possible.
Actual Logistics Calculation
We model the exact packaging style, stack density, and transport route for each part. xcPEP simulates cost based on load fill, distance, and duty for both sourcing cases. If the competitor has reduced freight cost by localising a supplier or optimising packaging, the platform quantifies the benefit so you can adopt a similar strategy.
Currency Exchange Impact
For any globally sourced part, xcPEP applies current exchange rates and associated charges. This allows ASI Engineering to isolate how much of your cost delta is driven by currency exposure. Where competitors have lower volatility or better cost control through localisation, we surface that insight as a savings opportunity.
Realistic Overhead Assumption
Overheads like setup time, quality checks, and indirect manpower are calculated from actual hours, not percentages. xcPEP breaks down each component of overhead for your part and the competitor part. ASI Engineering shows which overheads are inflating cost and how the competitor avoids them. This gives you a clear target for efficiency gains.
Accurate Input Rates
xcPEP uses region-specific data from xcPROC to ensure every cost model reflects real input rates across material, machine, and labour. ASI Engineering builds each comparison using rates that match your supplier location and production context, so the cost gap against the benchmark vehicle is accurate and defensible. Wherever the competitor benefits from a lower material index, cheaper manpower, or more efficient equipment, xcPEP makes the impact of those differences fully visible.
Updated & Precise Raw Material Rates
xcPROC continuously tracks live raw material prices across steel, aluminum, copper, polymers, and specialty alloys. ASI Engineering links every confirmed grade to the right price band for your sourcing region and the competitor region. This lets xcPEP calculate a clean material cost delta, isolating whether your gap is driven by grade choice, density, or market volatility.
Precise Machine Database
Machine hour rates in xcPROC are built from capital cost, operating life, cycle time, maintenance burden, and energy consumption. ASI Engineering assigns the appropriate machine class to each operation for both your part and the benchmark part. xcPEP then calculates the true machine cost based on plant-level utilisation, making equipment efficiency a transparent part of the cost comparison.
Precise Labour Hour Rates
Labour cost is calculated using actual regional wage structures, including base pay, allowances, benefits, and shift premiums. For each process step, ASI Engineering defines the required skill level and crew size. xcPEP uses this to compute labour cost for both your part and the competitor part, exposing any cost advantage due to reduced manpower or simpler operation logic
xcPEP
xcPROC
Automotive Cost Reduction Channels in xcPEP
Actionable ideas generated from part-by-part costing
Once ASI Engineering completes the structured comparison between your vehicle and a competitor, xcPEP automatically identifies where cost gaps exist—and why. The platform runs a detailed analysis across material choice, process design, layout efficiency, and sourcing conditions to surface savings that are real, specific, and feasible. Each idea is tagged with impact potential, mapped to a technical or commercial driver, and ready for your team to act on. What you get is not a one-time report, but a cost reduction engine that evolves with your product strategy.
Engineering Channels
Commercial Channels
Decontent
Remove features not present in the competitor part that do not affect function
Alternate Material
Use a more cost effective material that still meets design and performance targets
Alternate Manufacturing Process
Switch to a lower cost process that the competitor uses to achieve the same output
Complexity Joineries
Simplify part interfaces or joining methods to cut assembly cost and time
Routing & Packaging
Optimise layout or harness path to match more efficient competitor designs
Coatings
Reduce over-spec finishing and use coatings aligned to the competitor's durability standard
Alternate Supplier
Identify alternate sources already delivering the target cost for equivalent quality
Should Cost vs PO Price
Compare xcPEP should cost with supplier quote to reveal exact negotiation gap
Make vs Buy
Model cost difference between insourcing and outsourcing.
Workshops
Every cost reduction engagement ends with a hands-on workshop where ASI Engineering explains the complete set of ideas generated by xcPEP, should cost analysis software. Each idea is presented with supporting data, feasibility logic, and a direct comparison against the competitor part. Your team does not just receive a report—they understand the why behind every recommendation.
The sessions are split by function, with tailored walkthroughs for sourcing, engineering, and R&D. We also train your teams on how to navigate xcPEP so they can interpret part-level cost breakdowns, explore alternatives, and use the platform for future product decisions.
How are we different from Management Consultants
Traditional management consultants rely on generic frameworks and experience-based guidance. ASI Engineering delivers cost reduction outcomes by combining domain expertise with purpose-built software tools like xcPEP and xcPROC. Our approach is grounded in data, not decks.
While consultants focus on billing more hours, our goal is to help you internalise the capability—by building cost models, transferring knowledge, and deploying the software so your team can take over. We do not stop at recommendations. We give you a repeatable system.
ASI
Management Consultants
Uses Real Part Cost Data
Deploys Software You Can Use
End goal - Onboard you on xcPEP & xcPROC
Trains Your Internal Teams
Wants to Sell More Projects
Primary Goal is Cost Reduction
Automotive Should Costing Lab
Product Studies
Cost reduction case studies built from full teardown and benchmarking
This section features internal cost reduction studies executed by the ASI Engineering team. Every part is torn down, measured, and modelled independently by ASI to compare cost drivers. The goal is not just to estimate cost, but to understand where design, material, and process choices lead to excess spend—and how those gaps can be closed.
Each study shows how structured data, real manufacturing logic, and the xcPEP platform combine to surface defensible cost-saving ideas.