EV Charger Teardown & Cost Driver Comparison
Disclaimer
This study was conducted entirely in-house by ASI Engineering to demonstrate the capabilities of the xcPEP® platform. The product was independently procured by ASI. No proprietary or confidential information from any other party has been used. Results are not updated after publishing.
Software platforms used for this study
This study is powered by ASI’s proprietary should-costing ecosystem - xcPEP and xcPROC - engineered to deliver real-world accurate, traceable should-costing across mechanical, electrical, and electronics components..

xcPEP delivers real-world accurate, transparent & defensible should cost analysis of mechanical, electrical & electronics components from drawings or physical parts.
Explore xcPEP →
xcPROC is the centralized database engine powering xcPEP. Built entirely by ASI’s data research team, each database is meticulously curated to be region-specific and time-specific.
Explore xcPROC →Recently we conducted a teardown for VA/VE exercise on EV Charger from two different OEMs, while doing so we formulated a strategy to reduce the cost of charger PCB used in automotive 2W applications by 11%.
At Advanced Structures India we use Engineering Intelligence augmented with a proprietary xcPEP tool to map material, architecture, manufacturing, complexity, and cost in a comprehensive manner. The cost drivers are compared up to the last level of detail & ideas for cost reduction are generated.
This blog will focus on our findings while comparing the EV chargers for 2 Vehicles in following areas:
- Charger’s packaging study & its comparison
- Component complexity in chargers and Component Size Range in PCB
- Charger & PCB Material
- Cost Analysis
- Comprehensive comparison & cost reduction through xcPEP
Competitor selection is an important step in order to generate large number of ideas as we can have access to industries most cost-effective solutions that can be challenged with your practices. Generally, the cost reduction activities for products done in absolute turn out to be 40% less effective than a comparative study.
Charger Packaging Study & Its Comparison
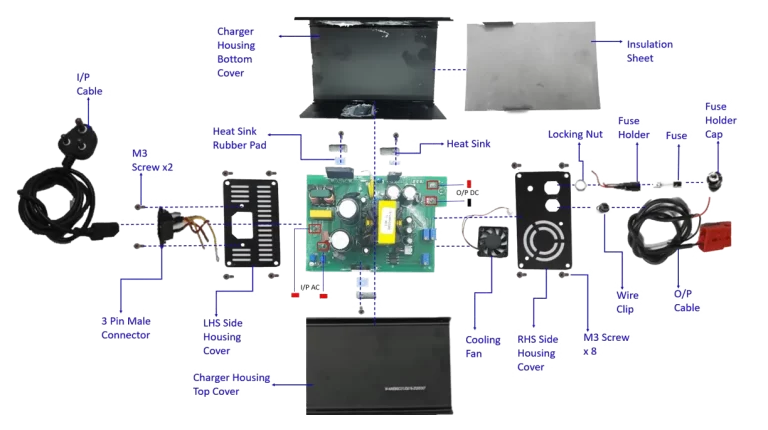
Charger A
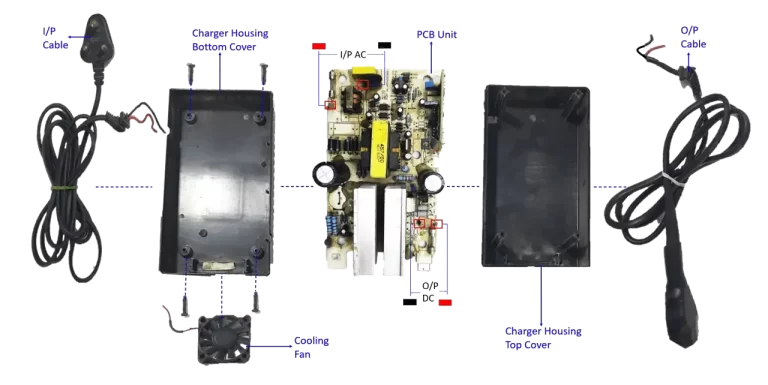
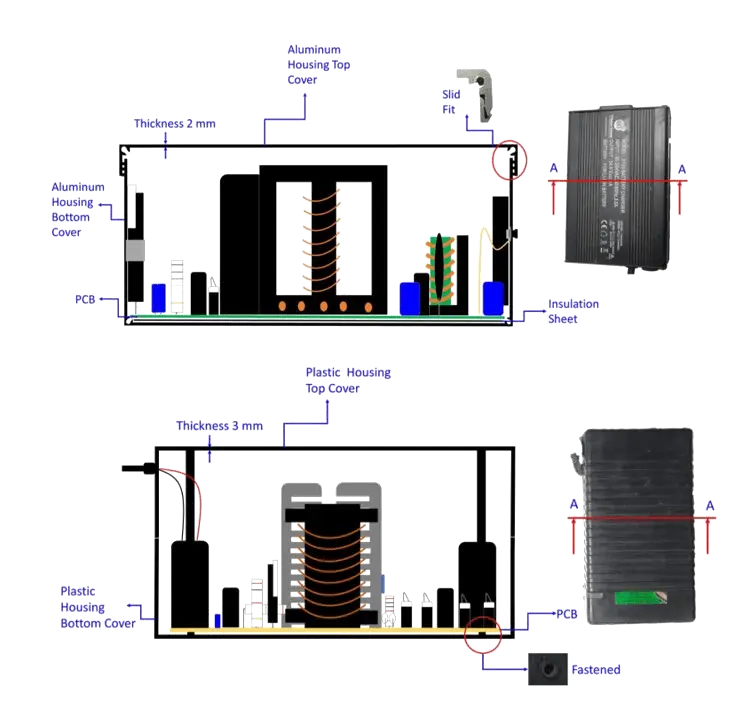
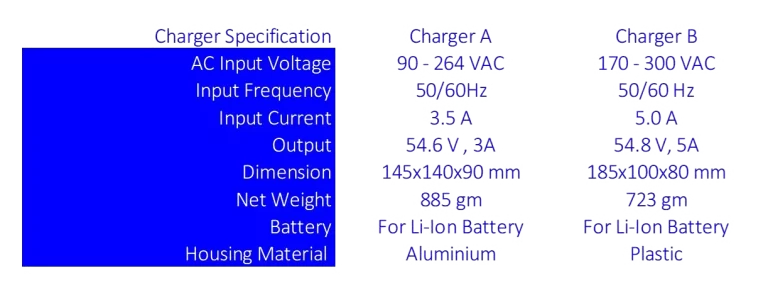
While comparing both the charger it is observed that the packaging design of chargers are much more complex in Charger A because it’s housing is a 4-piece design compared to 2-piece design in Charger B, which further require a greater number of fasteners (10 more fasteners) for assembly of charger. This affects the manufacturing cost and time. Although the charger B is of slightly higher spec. (Refer Spec Table Below)
Also, assembly of harness was observed to be more complex in Charger A when compared to Charger B, In Charger A, a Male and Female connector were provided to connect power chord with charger assembly as compared to Charger B. Increasing the cost of assembly by 6 %.
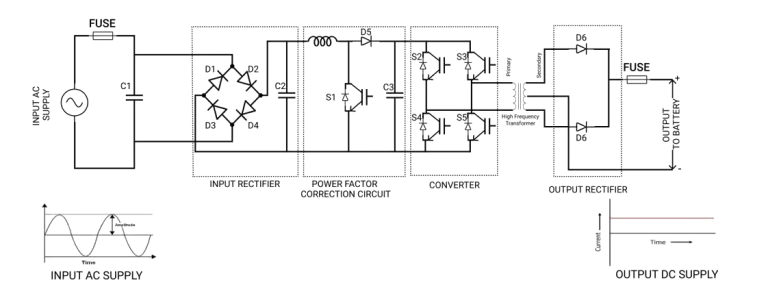
Charger A
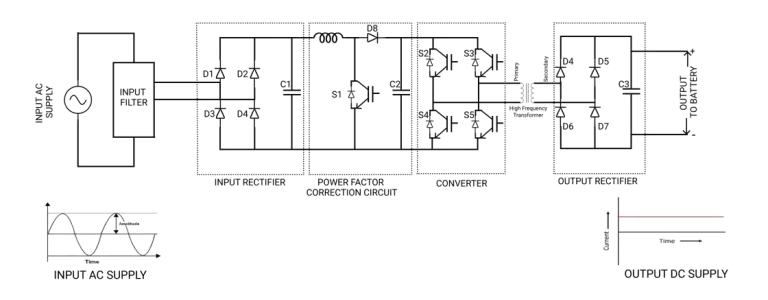
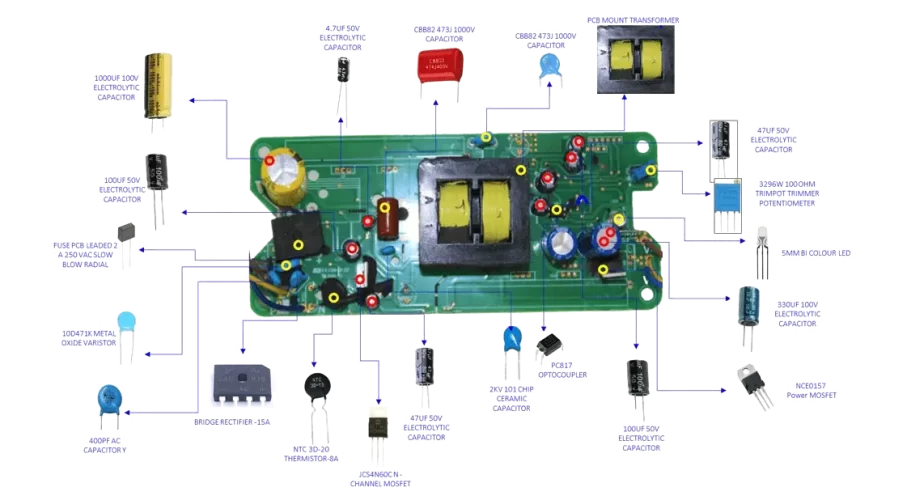
Even though the charger specification were found similar the overall philosophy of PCB circuit and usage of components were quite different in both chargers.
- In PCB of Charger A there is bridge rectifier (GBU808) packaged but same in Charger B is managed by using 4 single diodes (IN5408), which costs 40-70% lesser than bridge rectifier.
- A potentiometer is placed in PCB of charger A unlike charger B, this saved the overall PCB component cost by 1 % for Charger B.
- 2A 250 VAC slow blow radial fuse is provided in PCB of Charger A at input side only, but in PCB of Charger B it is provided with 2 Fuses one at input and another at output side, reducing fuse cost by 50% for Charger A.
- A single N channel MOSFET(FHA20N60) is used as a switching device in PCB of charger A where as in PCB of Charger B there is an integrated off line switcher (TO252-262).
Component Complexity in Charger and Component Size Range in PCB

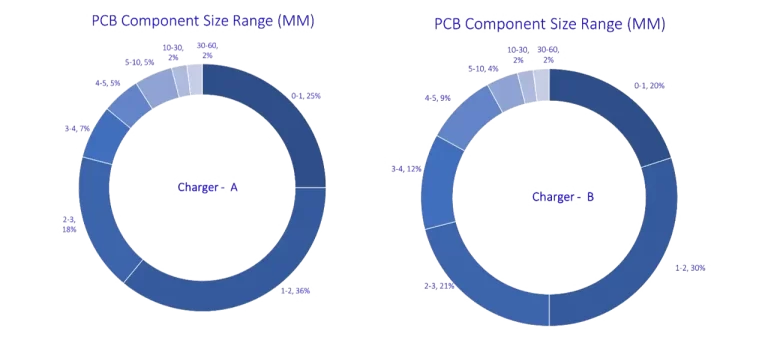
Number of components were higher in PCB of Charger A (174 Components) than PCB of Charger-B (152 Components) leading to higher complexity of the circuits, assembly & size of the PCB.
Also, while studying component size and component spacing it was observed that in PCB-A, 45% of component size were used in range 0-2 mm while in case of PCB-B, only 39% of component was found in the range of 0-2 mm.
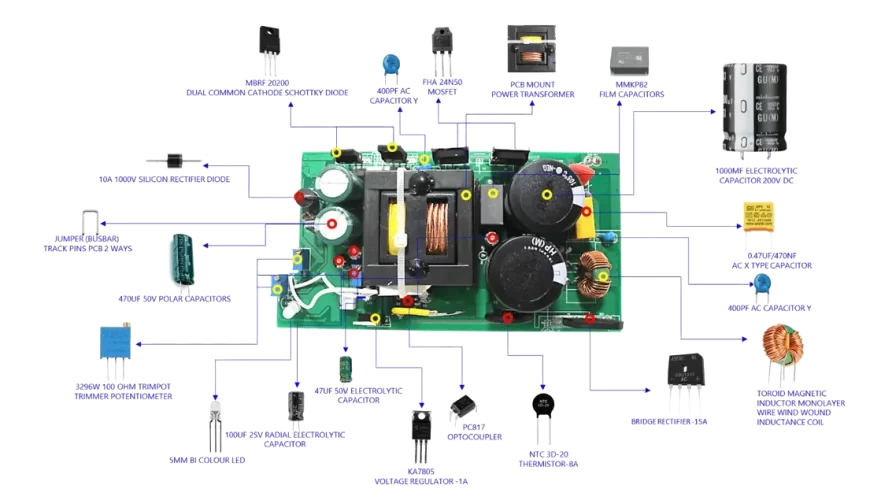
PCB - Charger A
PCB - Charger B
Thumb rule says a lower quantity of component and larger size component’s usage is economical because assembling them on board will require a machine with lesser tolerance and better precision. Similarly on PCB packing components closely again increase the cost of assembly although it decreases the board size.
So, based on the basis of this analysis multiple suggestions were made to the client where consideration was to check the feasibility of an increase in component size and spacing.
Material used in Charger and PCB
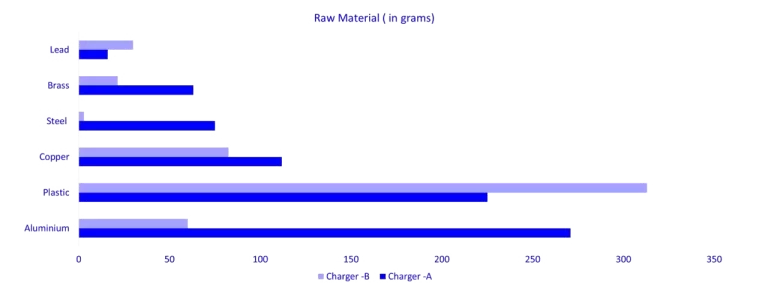
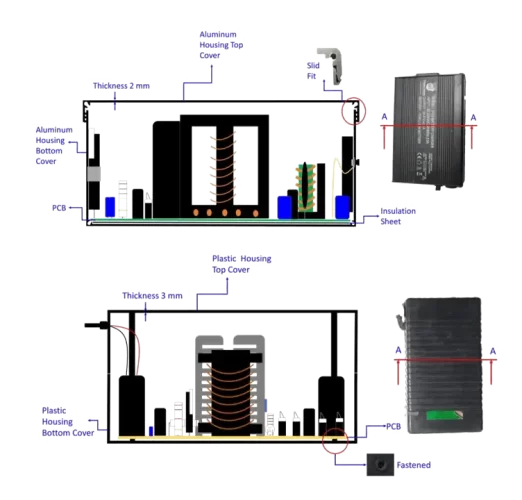
On analyzing the material present in both Chargers, it is observed that an extruded aluminum casing present in Charger A compared moulded plastic casing present in charger B. Which results in lower cost of charger casing in charger B by 30%.
Also, steel weight observed to be higher in charger A, as two steel plates are provided to close the aluminum casing at the ends, whereas in charger B the plastic housing is a box type structure where extra component is required to close it. This resulted in higher assembly weight in charger A by 8 % and cost by 12 %.
As per the spectroscopy result, we found that FR-5 was used for board fabrication in PCB of Charger -A compared to FR-4 in PCB of Charger -B even though the working environment conditions were the same for both. FR-5 value cost 10%-15% more than normal FR-4.

Thickness range of surface finish in PCB of Charger-A was on the higher side compared to PCB of Charger-B, but since the size of the component was larger in PCB of Charger-B the total area covered was more compared to PCB of Charger-A.
Even though ISn is an economical choice but it comes with some drawback, after the tin is deposited on copper it starts to tarnish, that result in less shelf life. If production is high ISn surface finish can be preferred as an economical option.
As per analysis based on study and properties, our recommendation to the client was to check the feasibility of changing the surface finish from ENIG to ISn. So, if the client’s production value is high, they can go for ISn to save by 8%-12% of the cost on charger.
Cost Analysis:
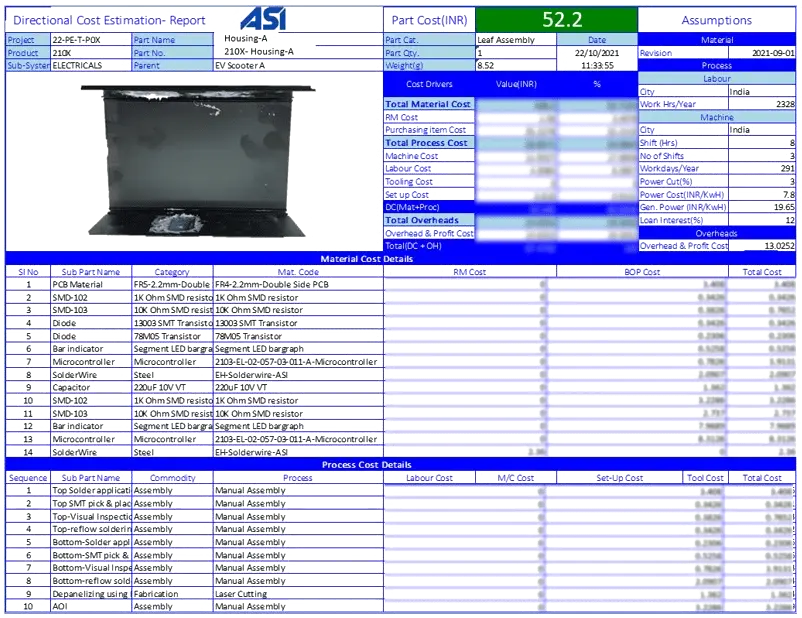
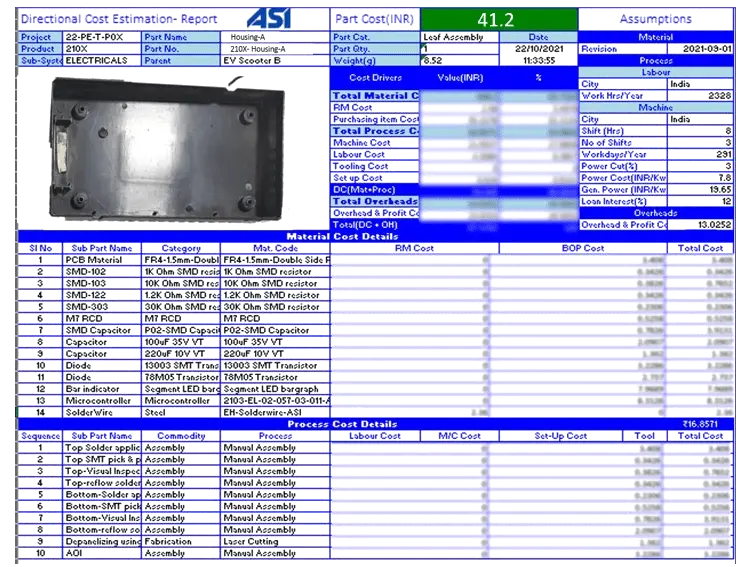
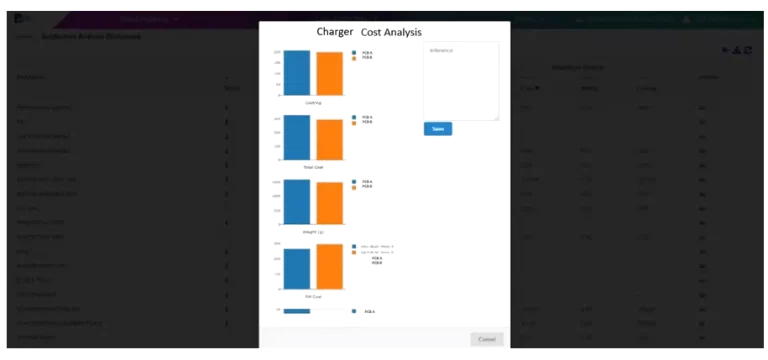
Should cost (SC) of both the Chargers were estimated on our xcPEP costing module with pre-configures cost models. It was found that due to high complexity and more number components of Charger A the cost was on the higher side when compared to Charger B. Following images are the downloaded reports from xcPEP costing module.


Comprehensive Comparison & Cost Reduction through xcPEP
Bill of Material (BOM) generation:
We map critical data of base product & competitor product with high quality images to generate a Bill of material (BOM) by using our inbuilt xcPEP tool.
xcPEP is our eXtremely Comprehensive Product Engineering Platform with inbuilt tools backed by machine learning trained on automotive component data, to compare data and generate cost reduction ideas.
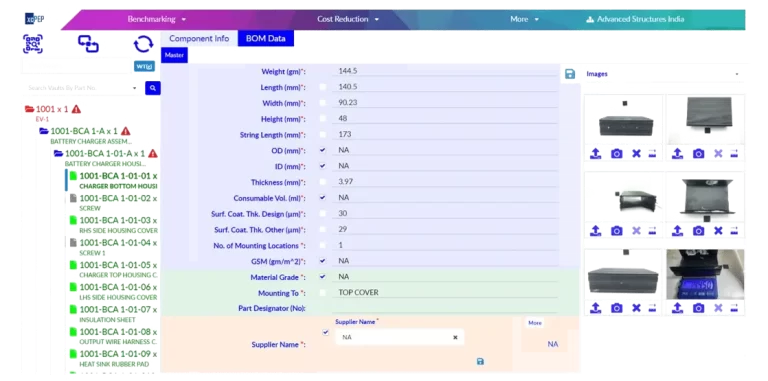
Circuit Diagram/Schematics
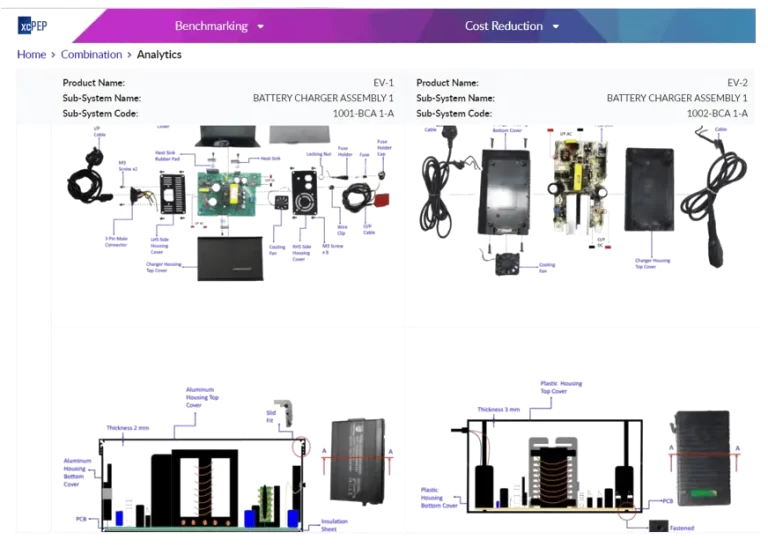
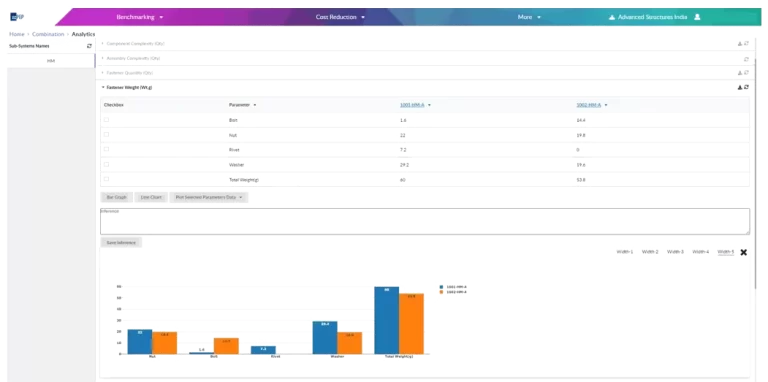
Data Analytics
Cost Estimation
Cost saving idea generation using xcPEP tool
The xcPEP tool generates cost saving ideas from the generated BOM at product and level, as per user requirement. The Engineers at ASI evaluates the generated ideas, adds value & does feasibility to the idea generated by the xcPEP tool.
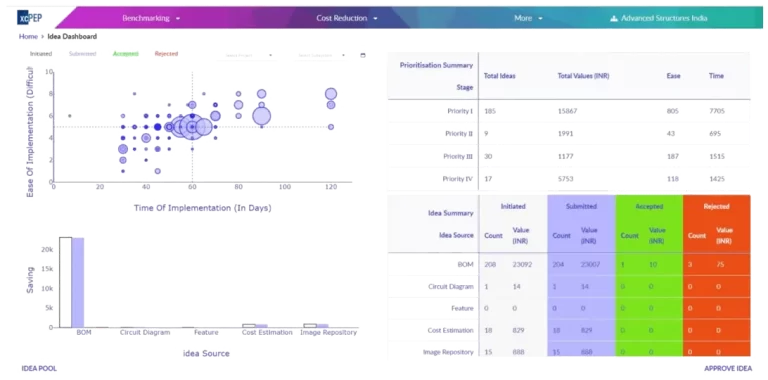
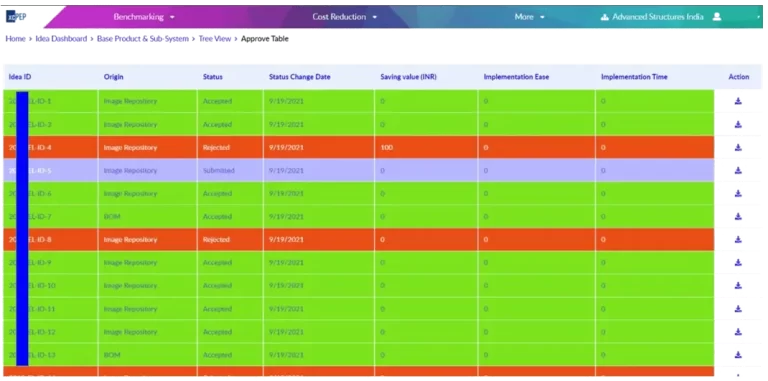
From the above-mentioned methods and idea suggestions, we have generated ideas on Charger A, and 41% of the total generated ideas were implemented. This resulted in total cost savings of 9.3% of Charger A.

